
 Open Access||Research Article
Sentimental and Time Series Study of Coronavirus Immunization Tweets Using VADER
1 Engineering College Bikaner, Bikaner, Rajasthan, 334004, India
2 Bikaner Technical University, Bikaner, Rajasthan, 334004, India
Abstract
A suitable platform for sentiment analysis of people is one of the hidden advantages of social channels. This has led to drawing the focus of various research communities and hence sentimental study has gained much awareness in recent years. Among the available options, Twitter happens to be the most accepted of all functional platforms. Identifying the well-defined methodology or technique for sentimental study related to data available on Twitter concerns the selection of an eligible set of data and such study of results is the prime focus of our research. In this research, there is an analysis of public sentiments expressed in the Twitter database regarding the Coronavirus disease (COVID-19) vaccine. With a flood of information-carrying myth and reality about COVID-19 vaccine vegetation of uncertainties, the component of excitement and fear started growing across the globe. The polarity of sentiments that could be of any type i.e. neutral, positive, negative when identified on a time scale generates trend analysis for a suitable approach. After capturing public thoughts, opinions and feelings systematic literature review is performed and an investigational prototype is generated in order to scatter the sentiments on the inspected data & recognize the everyday sentiment over the span of the timeline. Documentation of fluctuations in daily sentiments is shown through time series analysis. This research reflects the set of data related to tweets captured from September 21 - March 22. As per our findings, the Valence Aware Dictionary and sentiment Reasoner (VADER) sentiment analyzer is the best and most effective model to get optimal results from the collected sentiments, and the polarity score is recorded over some time. This research enhances the interpretation of the public’s point of view on coronavirus immunization and helps them focus on removing COVID-19 from the rest of the world.
Keywords
1. Introduction
Coronavirus outbreak has introduced good-sized interest to the healthcare area these days, and it has caused the replacement of the idea of protection with each element of our existence. Social distancing is a successful practice for lowering the growth of Coronavirus disease (COVID-19).[1] Protection course of action which includes the adoption of masks, washing palms at several time intervals, and staying cautious concerning intimacy is presently essential. But those could be the handiest lessen the growth of COVID-19 instead of removing it. With sanctioning of COVID-19 vaccines by renowned pharmaceutical giants such as Pfizer or BioNTech, Moderna, Oxford or AstraZeneca, Covaxin, and Sputnik V, a component of relief was observed across the world. But soon myths and facts started floating about the whole vaccination process on social media platforms which provoked some people to remain hesitant about receiving a vaccine for COVID-19. World Health Organization (WHO) also admitted it by stating this became one of the biggest threats to global health in 2019. Nowadays, social media forms i.e. Instagram, Twitter, Facebook, and YouTube have become integral parts of everyday lives. This has become a valuable resource referred to as social data. Events that happen in everyday life are shared willingly on media platforms, and anyone is free to write comments and suggestions. People discuss and give their thoughts about these events. Furthermore, social forums are extensive sources of facts for upcoming and trendy businesses to get a feel of public perception and obtain reviews about the products they manufacture. A lot of facts regarding the coronavirus vaccine are available on various social forums. Compared to other social forums, Twitter is found to be the first pick when comes to information because it provides ample information that is suitable for time series sentimental analysis.[2] Twitter is a well-known microblogging utility that lets a user share and illuminates real-time messages called tweets. Microblogging services today have become eminent and consistently used platforms. Extraction of data is a challenging task as there is a use of informal language, non-textual content, dialects, acronyms, multiple punctuation marks, and emotions used to express their sentiments.[3] Tweets obtained from Twitter enable investigators to capture a large variety of content, thereby giving freedom to gaining insights into early feedback plans of action. There is a categorization of trending tweets and they are classified into collective categories i.e Tech, News, and sports. Twitter also uses distinctive features i.e. ashtags, tags using @, emoji, and Hyperlinks.
In the modern era of a data-driven environment, Sentiment analysis has opted as one of the in-demand fact-finding subjects in the area of NLP (Natural Language Processing) which in turn is closely associated with artificial intelligence. Some uses of sentimental analysis can be discovered in news articles & product reviews.[4] The results of sentimental findings are implemented in public market investigation and decision-making. In our research, to execute sentimental analysis, we have considered a set of data captured from Twitter API alongside a tweepy python package which is required to predict the sentiments from the data.[5]
In this research, the sentimental analysis technique was put into the collected data and a comprehensive description is stated. A literature study put forward that several investigators are operational for sentimental analysis on Twitter. In extension to those research works, our research explains the best suitable way for performing the sentiment analysis on the Twitter data and time-based analysis on the Twitter trends over the timeline of the COVID-19 vaccine. Sentiment analysis (SA) is a knowledgeable system of extricating a person's emotions and feelings. It’s far mostly pursued domains of NLP (Natural Language Processing).[6] The Time-based evaluation is a sequence of observations collected in consistent periods which means emerging models to evaluate the observed time series. In this research, the VADER (Valence Aware Dictionary and sentiment Reasoner) assesses tweet polarity & classifies tweets with the help of multi-class sentiment analysis.[7]
2. Literature review
Alhaji et al. performed their research work with the help of an ML (machine learning model) i.e. Naive Bayes to perform sentimental analysis on tweets in the Arabic language using Python's NLTK library.[8] The hashtag's tweets were associated with seven government-urged public health initiatives. A huge number of 53,127 tweets were examined in this study. The number of tweets reflecting positive sentimental analysis was greater than negative ones. Kaur and Sharma after collecting relevant tweets from Twitter API, thoroughly examined the sentiments related to both disease and virus of COVID-19.[9] They employed ML (machine learning) methods or processes to discover sentimental emotions in this study. The NLTK library was utilized to accomplish the preprocessing and the text blob data sets were utilized for Twitter investigation. Various visualizations were used to project the exciting end results sentiments. In comparison to this research, they implied the ML methodologies to identify products for sentiment investigation. In addition, we utilized the lexical-based technique for sentiment analysis and performed time series analysis in our research. Tweets connected to #corona-virus, according to Prabhakar Kaila et al., were appropriate for applying and evaluating sentiment analysis of COVID-19.[10] They investigated the information acquired in the record named matrix from the data sets using the LDA (Latent Dirichlet Allocation) technique. Using LDA approaches, a tremendous amount of information on the COVID-19 infected paramedic was revealed, including positive sentiments such as trust and negative sentiments such as dread.[11]
Gilbert et al. developed VADER, a directive enabled sentimental analysis tool which is best fit for sentimental analysis related to social media.[12] SentiWordNet, ANEW (Affective Norms for English Words), the General Inquirer, LIWC (Linguistic Inquiry & Word Count), and ML techniques which depend on Naive Bayes, Maximum Entropy and SVM (Support Vector Machine) algorithms were compared to its efficiency for 11 typical state-of-the-art benchmarks. The development, endorsement, and testing of VADER were identified in the research study.[13] To diagnose the sentimental lexicon utilized in the social domain, the investigators equipped quantitative & qualitative techniques. Findings show that VADER enhanced the potentials advantages related to LIWC. VADER distinguished itself when compared to LIWC by being more attentive to social media sentiment expressions. Medford et al. used the dataset of coronavirus hashtags to look for specific tweets for 2 weeks. i.e. Jan 14 - Jan 28, 2020.[14] Application Programming Interface captures the tweet and stores it in the form of plain text in most cases. This study uncovers and analyses connected frequency terms i.e. vaccination, and infection preventive techniques. The sentimental study was utilized to assess the sentimental state and dominating sentiment of each tweet. Lastly, with the help of an unsupervised ML technique, significant themes in tweets are carefully analyzed and discussed over time. Cherish Kay Pastor et al. express the thoughts and feelings of Filipinos as a result of the intense society quarantine imposed by the COVID-19 Pandemic, particularly in Luzon.[15] Based on the users' tweets, the researcher also investigates harsh community quarantine and other Pandemic repercussions on current life. To acquire a better sense of user attitudes from extracted tweets, the Natural Language Processing methodology is frequently employed. The collected opinions are the data examined in this process.[16] In this study, AD Dubey, A. D et al., collected and analyzed tweets from a total of twelve states within a specified time frame. The tweets were captured from March 11 - March 31, 2022. The purpose of this research is to observe people's reactions to disease outbreaks in these countries.[17]
A careful task of pre-processing with the removal of irrelevant information from tweets is performed for a productive outcome. A ray of hope with positive thinking is observed in these societies, but the sign of grief and pain also floated among them. Mainly four states of the European continent believe they cannot trust the situation due to the effect of this pandemic on the huge population.[18] Looking at previous studies most researchers used Python's NLTK package and the Twitter API to extract corona-virus-related tweets.[19] Both machine learning approaches and VADER sentiment analysis approaches were implemented to perform sentiment analysis.[20] Other methods, such as LDA (Latent Dirichlet Allocation), were also used. In this thesis, as per a systematic literature review, we have used the VADER sentiment analyzer to perform sentiment analysis using NLTK python’s library. Twitter API is utilized to capture the dataset with the help of Twitter. Time series analysis is conducted for the study of daily sentiments of the people and also to find out the per day tweet counts.[21]
3. Methodology
In this study, we used two research methods that are systematic literature review and an experiment method. Starting with the literature review we carefully analyzed the data and choose the approach based on the results. Followed by this research questions were experimented with in which the distribution of sentiments was determined. Adhering to Marcus Gustafsson and Eric Gilbert's guidelines a systematic literature study was conducted to address RQ1. Several steps were taken to identify appropriate approaches for sentiment analysis. These steps are abbreviated as ACTION:
- An Identification of the keywords: Keywords identified in this process are: sentiment analysis, time-based analysis, and COVID-19 vaccine.
- Create the search strings: The search string is developed by choosing significant keywords from the keywords mentioned earlier.
- Trace the literature: Using a search string various digital database platforms were searched like Diva, Google Scholar, IEEE, and Research Gate.
- Inclusion and Exclusion criteria for selection: For better results inclusion and exclusion criteria are applied to the collected literature. Inclusion criteria are Articles & papers written only in English that too with approaches to sentiment analysis. Exclusion criteria involve articles with inadequate information.
- Organize, Evaluate and select the literature: After exercising the inclusion and exclusion criteria, the improvement is done by meticulously assessing and selecting the collected literature.
- Nutshell the concluded literature: Here outline of overall findings with representation for analysis is executed.
3.1 Experiment
Now it’s time to develop a model for assorting sentiments and evaluating RQ2 to predict the arrangement of daily sentiments over a time series. This process is carried out by an experiment. A series of steps adopted in this process are as follows:
3.2 Preparations for software environment
The development of this model progressed the usage related to Python. The models related to machine learning in this experiment were developed by using the following Python libraries:
- Python V.3.9: Python is a scripting language that is interpreted, interactive, and object-oriented. It is very legible and has fewer syntactical constructions than other programming languages.
- NLTK V.3.6.2: A Python package is known for working with human language data and providing a straightforward interface to lexical resources like WordNet and text processing libraries. These lexical resources are used to accomplish categorization, tokenization, stemming, parsing, tagging, and semantic reasoning.
- Pandas V.1.0.1: Pandas is a Python module that works with data structures and functions as a data analysis tool. Pandas perform the entire data analysis pipeline in Python, eliminating the need to use a more domain-specific language like R.
- Tweepy V.3.10.0: A Python package that connects to the Twitter API and obtains tweets from the platform. This is used to directly stream real-time tweets from Twitter.
- NumPy V.1.18.1: A fundamental Python computing package that extends the scalability of multi-dimensional arrays and matrices by providing a large number of high-level computational operations.
- Scikit-learn V.0.22.1: A straightforward and efficient tool for data mining and analysis.
- Matplotlib V.3.1.3: This Python package creates plots, histograms, power spectra, and bar charts, among other things. In this study, the matplotlib.pyplot package is utilized to plot the measurements.
3.3 Collection of data
As per the basic requirement of this study social media i.e. Twitter has been selected to gather the data sets. We have described the each of the steps for the execution of the entire work in sequential order. In the first step, we validate the relationship between Python and Twitter Microblog. Twitter makes its data available through public APIs which may be accessed via URLs. Python includes a tweepy package that allows accessing Twitter's data via the API. Calling required libraries, such as Tweepy, is the primary step in this operation. Alphabetic characters were collected in form of tweets from Twitter. A lot of emotional signs like a laugh, sadness, and even emojis to express feelings are also included by the users. The data collection is exercised for seven days, and each day's data is stored in different CSV files. Targeted information was the content & each of the tweets was associated with the timestamps. The Prime work was to capture the tweets and pass on the tweets to a function that delivers the sentimental investigation with the help of python's library. Extracting Twitter data from publicly available raw tweets in a real-time situation is the method used in this process. To collect the data Twitter API was used. Twitter API enables users to download tweets officially from a user account and save the tweets in a suitable file format. A total of 7,313 tweets were collected which were concerning the COVID-19 vaccine published on Twitter's public message board. Keywords such as #Pfizer & BioNTech vaccine, #corona vaccine 2020, and #COVID-19 vaccine were used to retrieve tweets. This is how the management of the most relevant tweets took place.[22]
3.4 Data overview
As shown in Fig. 1 dataset is extracted consisting of various fields. The various areas like user details and activities are described here. With 7,783 tweets 16 fields in total are focused. The fields are the user’s name, id, location, description, followers, friends, favorites, likes, dislikes, verified, created, date, text, hashtag, source, and re-tweets. The important fields like user_id, user_name, date, text, and hashtags, are majorly required and engaged in analyzing the data for the sentiment analysis.
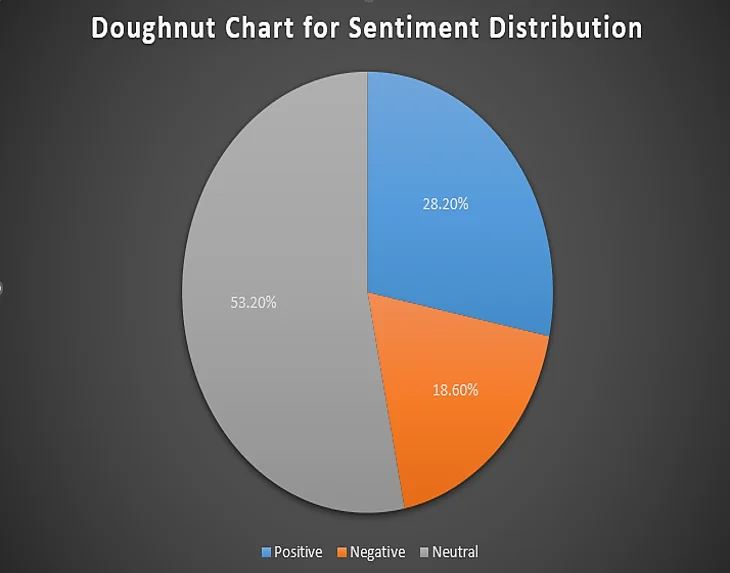
Fig. 1: Doughnut-chart of sentiment classification distribution.
3.5 Data pre-processing
As we know that on Twitter, a tweet is a micro-blog message with a limit of 140 characters only. The maximum number of tweets encompasses i.e. embed URL, plain text, photos, username, and emotions. Miswrite are commonly observed in them. An unstructured data on COVID-19 is captured with the help of Twitter & later exposed to text cleaning with screening, filtrate, and lastly, classification in this operation is what this study focuses on.[23] This is the reason we performed a series of pre-processing steps to eradicate irrelevant information from the tweets. For analyzing the text we needed to remove slang words, HTML characters, stop words, punctuations, URLs, etc.[24] For improved accuracy splitting of attached words is also performed for cleansing.[24] The rationale for this is that the cleaner the data is, the better it is for mining and feature extraction. All duplicate tweets and retweets were deleted from the last illustration of 14,500 tweets. Each and every tweet was parsed to deliver the core message. The Natural Language Toolkit (NLTK) of Python was utilized to pre-process this data. To begin, use python to detect and remove specific characters in tweets, i.e. URLs ("http://url"), retweets, user mentions & inappropriate punctuations. The hashtag (#) frequently describes the subject of tweets & includes useful information relevant to the tweet's topic, they’re included in the tweet, but the "#" symbol has been removed.[25]
cleaned_tweets = [] for tweet in tweets:
# String search - remove searched substring from string # RE for links: r'http\S+
# RE for @mentions: @[A-Za-z0-9]
cleaned_tweet = re.sub(r”http\S+|@[A-Za-z0-9]+”, ““, tweet[0]) # Store in a new list of lists with cleaned tweets cleaned_tweets.append([cleaned_tweet, tweet[1]])
The tweets were then converted to lowercase, and stop words (words with no essence i.e. is, he, they) were removed. Such tweets were then separated into separate words, then stemmed using the Porter stemmer. The dataset was ready for sentiment categorization after these pre-processing steps.[3]
3.6 Analysis of Tweet sentiment
The attitudes conveyed inside the tweets were categorized with the utilization of the VADER Sentimental Analyzer on the dataset. In order to categorize our data set, we first constructed a sentiment intensity analyzer (SIA). The feelings were then determined using the polarity scores approach. The already processed tweets were then categorized as in sentiments, or compounds by utilizing the VADER Sentimental Analyzer. The compound worth is a useful statistic for the scalability related to sentiment in a tweet. The compound score is measured by multiplying the valence ratings related to every term in the lexicon, which is later updated as per the guidelines & standardized to a range of -1 to +1. The threshold values divide tweets into good, negative, and neutral categories.[3,12] Refer to "(1)" for typical threshold values utilized in our study:
Classification of sentiments:
- Positive sentiments: compound value > 0.000001, assign score = 1
- Neutral sentiments: (compound value > -0.000001) and (compound value < 0.000001), assign score =0
- Negative sentiments: compound value < -0.0000001, assign score = -1
3.7 The KDE distribution for analyzed data
Tweets are separated based on their compound value. The tweet is categorized as a positive tweet when the compound value is more than the threshold level & as a negative tweet if the compound value is smaller than the threshold level. In the rest of the situations, it was seen as neutral. As a result, the three categories were created based on emotional values. Determination of the length of the model input is by the sentiment value, which is essential for model growth. Followed by this, a summary distribution of all sentiments is also offered by us. Kernel density calculations will be implemented first before the distribution is projected. While implementing the KDE graph, the Seaborn (Python data visualization) package founded on Matplotlib furnishes a high-end interface for generating KDE graphics.[26,16] Then, depending on emotion values, the CDF (Cumulative Distribution Function) is used to observe significant changes in the strength of sensations in data. It gives you the percent of the normal distribution function that is less than or equal to the random variable you gave. As a result, the CDF of the standard normal distribution divides overall feelings into sentiments i.e. neutral, negative, and positive categories built on sentiment values & density.
3.8 Sentiments in word cloud
The frequently recurring set of words in the above-distributed sentiments are found in this study, which includes both positive and negative sentiments about the tweets. The comments are displayed as a word cloud with a set of sentence probabilities, which helps to highlight the most often referenced words in the reviews. The word cloud shows the words which are more likely to appear in the sentence. For each of the leading positive and negative sentiments, a word cloud is constructed using the 'Word Cloud' packages.[27]
3.9 Allocation of daily sentiments over each partition of the time series analysis
A time-series overview of daily Twitter volume is used to break the sample timeline into smaller time intervals. Peaks in Twitter activity are discovered using time series analysis to show the underlying work process over time. This type of research uses continuous data as feedback to detect changes in situational information about a topic across time. This method of describing real-time events has been applied to a range of sectors, including economics, the environment, science, and medicine. To figure out where and when the changes happened, we employed a variety of methods, including autocorrelation and seasonal decomposition of attitudes. To create independent time series, we exploited both rapid variations in relative volume and occurrences. To begin, we divide the daily sentiments into three division periods and distribute them across the timeline for each partition, measuring the mean & SD (Standard deviation) related to positive & negative sentiments. After separating these tweets, we develop a model to show the SD and mean for positive and negative attitudes.
3.10 Decomposition of sentiments into systematic components and autocorrelation analysis
To reduce the lags in the built-in model, we employ autocorrelation analysis. The Pandas Series was used in the project. The Pearson correlation coefficient value is returned by the autocorrelation function (Pandas.Series.autocorr). The Pearson correlation coefficient is a representation of two variables' linear correlation. The Pearson correlation coefficient ranges from -1 to 1, with 0 indicating that there is no linear link, >0 indicating a positive association, and 0 indicating a negative relationship. A positive correlation coefficient reflects that 2 variables are in motion in the alike direction, whereas a negative correlation coefficient reflects that they’re in motion in opposing directions. To differentiate the data, we utilised a lag=1 (or data(t) vs. data(t-1)) and a lag=2 (or data(t) vs. data(t-2) (t-2). The autocorrelation plot was then utilized to measure the values of the autocorrelation method (AFC) opposite to various lag sizes. As the lag value grows larger, we compared fewer and fewer observations. The sum number of monitoring (T) must be at least 50, & the highest lag value (k) must be less than or equal to T/k, according to the general rule. We only considered the first 20 values of the AFC because we have 60 observations.[28-30] The data was then shown using time series decomposition. A time series could be divided into four dissimilar pieces using this method: trend, seasonality, residue, and noise. The season_decompose () function, which returns a result object, should be used. The result object provides an array that may be used to access the four-decomposition data.[30]
3.11 Analysis of daily trend with events related to that particular date
Prediction of data is done after performing seasonal decomposition and autocorrelation analysis. We segregated our dataset into “date”, “usernames", “text", and "hashtags" and also added an area as "count" (a routine counter). Finally merged the data based on the date field to observe the daily analysis of the tweets in our data.
4. Results and discussion
4.1 Results of literature review
To answer RQ1 an SLR (Systematized Literature Review) is executed as reflected in Table 1. The goal is to identify the most eligible system that accelerates perfect results of sentiment analysis. In the Systematic Literature Review, several publications were found on the sentiment analysis segment that utilized machine learning and lexicon-founded methodologies (SLR).
Table 1: Results of the literature review
| Title | Findings |
|---|---|
| VADER: A Stingy Rule-founded representation i.e. model for Sentimental inspection of social media Text | A comparison of VADER Sentiment scores and 10 different extremely popular sentiment analysis tools/techniques was measured that will give the best performance in all metrics. VADER scored highest among all with large datasets.[12] |
| Sentimental inspection for Tweets in Swedish | The typical method of sentiment analysis is briefly described in this paper for evaluation. Classified training data is required when employing a machine learning approach. The data will subsequently be used to train an algorithm that will predict the ordering of unknown data. Machine learning techniques were explored and tested, which is time-consuming given the scope of this paper. The VADER sentiment analyzer was chosen instead.[31] |
| Use of VADER and SVM for forecasting customer reaction sentiment. | Although this research is in a different area, it has been taken into account because it compares algorithm accuracy. VADER outperforms machine learning algorithms and lexicon-based techniques such as Support Vector Machines (SVMs) in terms of accuracy. |
| A Review of Social Media Posts from UniCredit Bank in Europe: A Sentimental inspection Approach | VADER has opted for sentimental inspection in this research since it performs well on brief documents i.e. Tweets.[32] |
| Broad research on Lexicon-founded Methodologies for Sentimental inspection | This work pertains to a separate domain because it compares the accuracy of lexicon-based techniques like VADER, Textblob, and NLTK.[33] |
| Hybrid procedure: naive Bayes & sentimental VADER for inspecting the idea of mobile unpack video comments | The sentiment analysis in this paper is done using a hybrid strategy that combines VADER and naive Bayes approaches. The lexical method for social media text used by Sentimental VADER has a positive impact on the Naive Bayes classifier in identifying sentiments.[34] |
According to most articles featured a comparison of machine learning and lexicon-founded techniques.[12,33-35] Twitter datasets demand a comparison of algorithms to find the best one. The VADER is widely considered the most extensively used technique for obtaining the best possible results for sentiment analysis classification.
4.2 Collected dataset using Twitter API
Table 2 displays a synopsis related to the data set obtained using the Twitter API. The collection of data includes the following crucial fields: id, user name, date, text, and hashtags, which are all used to analyze the data for sentiment analysis.
Table 2: Dataset overview
| S. No. | User_name | Date | Text | Hashtags |
|---|---|---|---|---|
| 1 | ###### ### | 20-12-2020 06:06:44 | Daikon paste could be used to treat a cytokine storm, according to the same people. #PfizerBioNTech https://t.co/xeHhIMg1kF | ['PfizerBioNTech'] |
| 2 | ###### #### ###### | 12-12-2020 20:17:19 | Explain why we need vaccination to me again, @BorisJohnson @MattHancock #whereareallthesickpeople e #PfizerBioNTech | ['whereareallthesickpeople', 'PfizerBioNTech'] |
| 3 | ######### # ####### | 12-12-2020 20:04:29 | There haven't been many sunny days in 2020, but here are a few highlights: 1. #BidenHarris winning #Election2020… | ['BidenHarris', 'Election2020'] |
| 4 | #### ###### | 12-12-2020 20:01:16 | Covid vaccine; You getting it? #CovidVaccine #covid19 #PfizerBioNTech #Moderna | ['CovidVaccine', 'covid19', 'PfizerBioNTech', 'Moderna'] |
| 5 | ######### ### | 12-12-2020 19:30:33 | #CovidVaccine States will start getting #COVID19Vaccine Monday, #US | ['CovidVaccine', 'COVID19Vaccine', 'US', 'pakustv', 'NYC', 'Healthcare', 'GlobalGoals'] |
| 6 | ### ##### ######### | Together we can win the battle against #COVID19 | ['covid19', 'We4Vaccine', 'IndiaFightsCorona', 'LargestVaccinationDrive'] |
4.3 Outcome of pre-processing the data
Table 3 summarizes the outcomes of the pre-processing procedures applied to the dataset. The number of words in reviews and vocabulary was greatly reduced as a result of this method. Given this outcome, the pre-processing phase was critical in assisting the researchers in cleaning up and removing extra words.
Table 3: Result after pre-processing the tweets
| Index | Text | Tokenized | No_stopwords | Stemmed_porter | Stemmed_snowball | Lemmatized |
|---|---|---|---|---|---|---|
| 0 | The same folks said daikon paste could treatcytoki... | [same, folks, said, daikon, paste, could, trea...] | [folks, said, daikon, paste, could, treatcytok...] | [folk, said, daikon, past, could, treatcytokin...] | [folk, said, daikon, past, could, treatcytokin...] | [folk, said, daikon, paste, could, treatcytoki...] |
| 1 | while the world has been on the wrong side of... | [while, the, world, has, been, on, the, wrong...] | [world, wrong, side, history, year, hope, bigg...] | [world, wrong, side, histori, year, hope, bigg...] | [world, wrong, side, history, year, hope, bigg...] | [world, wrong, side, history, year, hopefully...] |
| 2 | Russian vaccine is created to last 2 4 years | [russian, vaccine, is, created, to, last, 2, 4...] | [russian, vaccine, created, last, 2, 4, years] | [russian, vaccin, creat, last, 2, 4, year] | [russian, vaccin, creat, last, 2, 4, year] | [russian, vaccine, created, last, 2, 4, year] |
| 3 | facts are immutable senator even when you re n... | [facts, are, immutable, senator, even, when, you...] | [facts, immutable, senator, even, ethically, s...] | [fact, immut, senat, even, ethic, sturdi, enou...] | [fact, immut, senat, even, ethic, sturdi, enou...] | [fact, immutable, senator, even, ethically, st...] |
| 4 | explain to me again why we need vaccine | [explain, to, me, again, why, we, need, vaccine] | [explain, needvaccine] | [explain, needvaccin] | [explain, needvaccin] | [explain, needvaccine] |
4.4 Results obtained after using VADER
The findings of Twitter sentimental inspection utilizing the NLTK and VADER sentimental inspection tools are described in this section. The VADER Sentiment Analyzer calculated the sentiment scores for each tweet as positive, negative, neutral, or complex in Table 4.
Table 4: Sentimental outcome of tweets utilizing the Vader
| Compound | Negative (neg) | Neutral (neu) | Positive (pos) | Tweet |
|---|---|---|---|---|
| 0.1531 | 0.000001 | 0.000001 | 1.000001 | folk said daikon past could treat cytokinstor... |
| -0.5859 | 0.125001 | 0.766001 | 0.109001 | world wrong side history year hope biggest vaccine |
| 0.0 | 0.000001 | 1.000001 | 0.000001 | explain need vaccine where are all the sick people |
After applying the thresholds indicated in Section 4.4, Table 5 illustrates the categorization of tweets i.e. favorable, neutral, or negative. We utilized VADER to select the proper thresholds to directly classify tweets i.e. good, neutral, or negative as indicated per Section 3.6. The overall sentiment score and polarity of each tweet are shown in Fig. 2. This is dependent on the scoring guidelines and how tweets are classified as positive, negative, or neutral. Overall sentiments are distributed into the three different classes i.e. negative, neutral, and positive aligning to their sentiment values as reflected in Fig. 2, which presents a total number of tweets into three classes: neutral, positive, and negative as per their sentiment values in the collected dataset. depending on the outcome displayed in Fig. 2, many tweets in the collected data set demonstrated positive or neutral opinions regarding the COVID-19 vaccine. Although, as shown in Fig. 1, 28.2% of the tweets have shown a positive outlook, 18.6% of the tweets have shown a negative outlook, and 53.2% of the tweets have shown neutral views. Because of the tiny number of tweets, the neutral proportion was the highest among all other classifications, resulting in unreliable results. The utilization of a generic lexicon to describe the Twitter data may have led to the belief that the threshold value may give numerous impartial opinions.
Table 5: Overall sentiment polarity for every tweet
Table 5: Overall sentiment polarity for every tweet
| Tidy Tweet | Tidy hashtags | Sentiment | Positive Sentiment | Neutral Sentiment | Negative Sentiment | Number of words |
|---|---|---|---|---|---|---|
| Folk said daikon past could treat cytokinstor… | Positive | 0.000001 | 1.000001 | 0.000001 | 8 | |
| World wrong side histori year hope biggest vac… | Negative | 0.109001 | 0.766001 | 0.125001 | 21 | |
| Coronavirus sputnikvastrazenecapfizerbiontec | Sputnik astrazeneca pfizerbiontechmoderna | Neutral | 0.250001 | 0.750001 | 0.000001 | 9 |
| Fact immut senatevenyour ethic sturdy enough… | Neutral | 0.000001 | 1.000001 | 0.000001 | 20 | |
| Explain need vaccin Whereareallthesickpeopl | Neutral | 0.000001 | 1.000001 | 0.000001 | 7 |
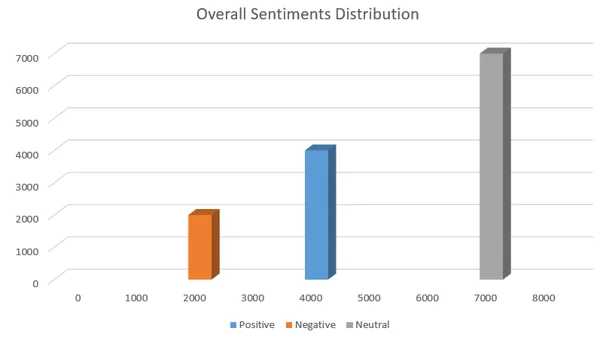
Fig. 2: Overall sentiments distribution.
4.5 KDE distribution results for the analyzed data
Fig. 3 shows a KDE plot based on plot data, which shows the estimated distribution of each sentiment. Seaborn, a Python data visualization toolkit founded on Matplotlib, furnishes a high-end interface related to implementing KDE visuals. The normal distribution of the sentiments i.e. neutral, negative, and positive over the tweets as per the sentimental values is shown in Fig. 4. The majority of sentiment values fall between -0.5 and 1.5. For the positive, negative, and neutral values, we selected green, red, and orange colors, respectively. It's also evident that the majority of people are indifferent. We can see from the graph below that the distribution of neutral sentiments is higher than the distribution of positive and negative sentiments across tweets, and that most tweets do not resemble a more positive or negative view of almost neutral.
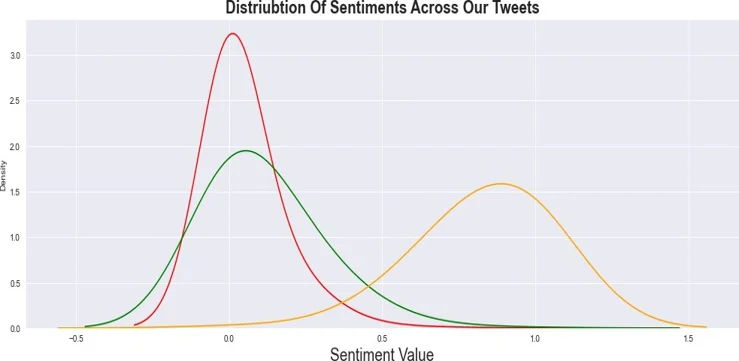
Fig. 3: Normal distribution of sentiments across our tweets.
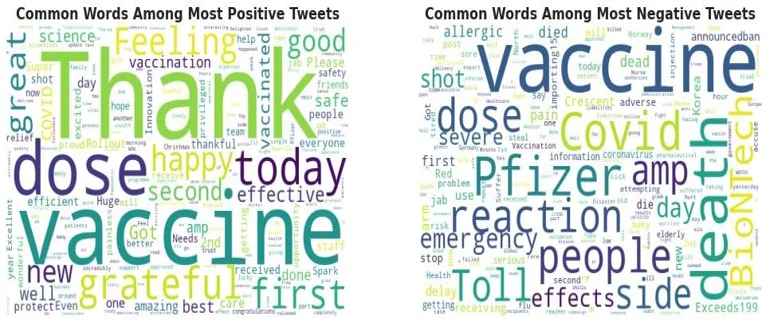
Fig. 4: Word cloud of the top positive and the negative sentiments.
Fig. 5 shows the CDF of the standard normal distribution. The overall sentiments are distributed into positive, neutral, and negative according to their sentiment values and density.
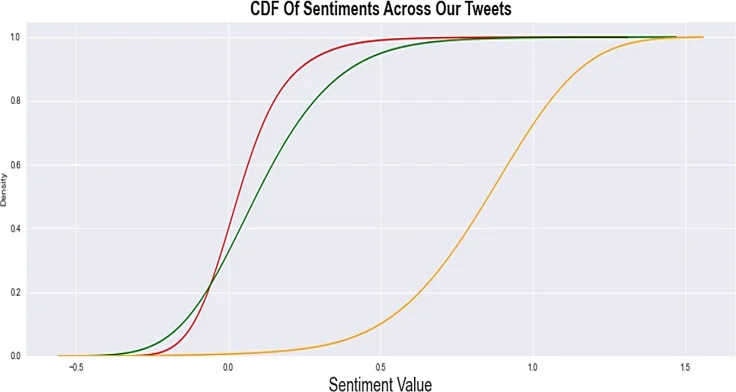
Fig. 5: CDF of sentiments across our tweets.
4.6 Sentiments results in word cloud
The trigram of 15 statements in Tables 6 and 7 begins with one of the top ten positive and negative tweet words. The probability of the sentence will appear in a random 'extremely' negative tweet. Positive and negative connotations, as well as degrees of positive and negatives, are assigned to the terms. The total sentiment of a sentence is calculated by aggregating the words' sentiments. We may conclude from a few more tweets that it is frequently imperfect, but on average, it reaches the proper findings. Fig. 4 shows the most negative sentiments and the most positive sentiments by using the word cloud. In Tables 6 and 7, we used the random colorization scheme to color the terms according to the Probability of the Sentence.
Table 6: Trigram of 15 sentences one of the top ten positive tweets
| Sr. No | One of the top 10 words | 2nd word | 3rd word | Probability of sentence |
|---|---|---|---|---|
| 0 | Today | Thank | You | 1.000000 |
| 1 | Vaccine | Happy | Dr | 1.000000 |
| 2 | Vaccine | Technology | has | 0.835690 |
| 3 | vaccine | Reduces | the | 1.000000 |
| 4 | first | Vaccination | This | 0.666667 |
| 5 | good | Watched | another | 1.000000 |
| 6 | today | In | and | 0.100000 |
| 7 | so | Here | is | 1.000000 |
| 8 | dose | Done | amp | 0.531250 |
| 9 | vaccine | Safe | COVAX | 1.000000 |
| 10 | grate | To | stop | 0.524390 |
| 11 | vaccine | Grateful | if | 1.000000 |
| 12 | first | Dosage | on | 0.500000 |
| 13 | dose | Done | one | 0.631250 |
| 14 | vaccine | Canada | federal | 0.620000 |
Table 7: Trigram of 15 sentences one of the top ten negative tweets
| Sr. No | One of the top 10 words | 2nd word | 3rd word | Probability of sentence |
|---|---|---|---|---|
| 0 | vaccine | Sending | this | 0.490678 |
| 1 | Pfizer | BioNTech | Vaccines | 0.125000 |
| 2 | 19 | Live | Updates | 0.210567 |
| 3 | vaccine | In | kids | 0.166667 |
| 4 | vaccine | US | already | 0.333333 |
| 5 | covid | Vaccine | Neck | 0.314925 |
| 6 | Vaccine | Tomorrow | little | 0.333333 |
| 7 | people | Including | BAME | 0.476557 |
| 8 | vaccine | Of | course | 0.266463 |
| 9 | Vaccine | Of | his | 0.500000 |
| 10 | vaccine | To | be | 0.400000 |
| 11 | vaccine | Was | dev | 0.271429 |
| 12 | amp | 2nd | do | 0.470000 |
| 13 | The | Event | was | 0.352545 |
| 14 | Pfizer | Covid | Vaccine | 0.242857 |
4.7 Distribution of daily sentiments results over each division of the timeline
Table 8 displays the mean and standard deviation (SD) for positive and negative attitudes, separated into three partitions to disperse daily sentiments along with the timeframe for each partition. The attitudes are spread daily over each partition, as shown in Fig. 6, as the tweets convey positive and negative sentiments that surge at different times. For example, the highest opposed end happened on December 14, which represents the most negative attitudes, whereas the greatest positive sentiments occurred on December 23. However, the amplitude of the surges decreased after these incidents, lasting only a few days. Besides, the standard deviation (σ) trend line was consonant all over the duration, while the mean (μ) declined because of the lower number of tweets with regard to the end of the era. The sentiments of the tweets do not meet statutory requirements in terms of non-constant mean and variance, as seen in Fig. 6. We have tested our hypothesis on three partitions of our data in the above code cell. It implies that the data has some patterns.
Table 8: Mean and the SD of the sentiments in each partition
| Partition_1_ Mean | Partition_2_ Mean | Partition_3_ Mean | Partition_ 1_SD | Partition_ 2_SD | Partition_ 3_SD | |
|---|---|---|---|---|---|---|
| Positive Sentiment | 0.106981 | 0.111546 | 0.112899 | 0.154634 | 0.155414 | 0.159998 |
| Negative Sentiment | 0.047555 | 0.051127 | 0.041657 | 0.104322 | 0.103279 | 0.098980 |
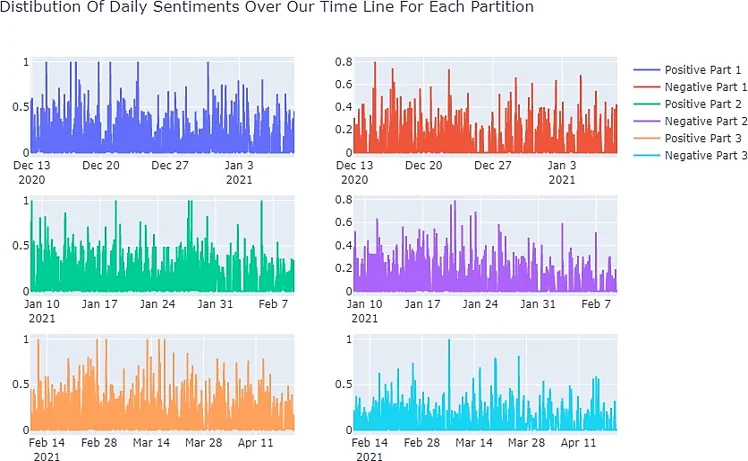
Fig. 6: Distribution of daily sentiments over the timeline of each partition.
4.8 Results for autocorrelation analysis and the decomposition of sentiments into systematic components
Fig. 7 shows that the ACF values are within a 95% trust zone (constitute by the solid grey line). It ensures that our data is free of autocorrelation for lags greater than 0. The trend and seasonality information collected from the series appears to be reasonable in Fig. 8. The residuals are also intriguing, revealing times in the series with strong variability trends.
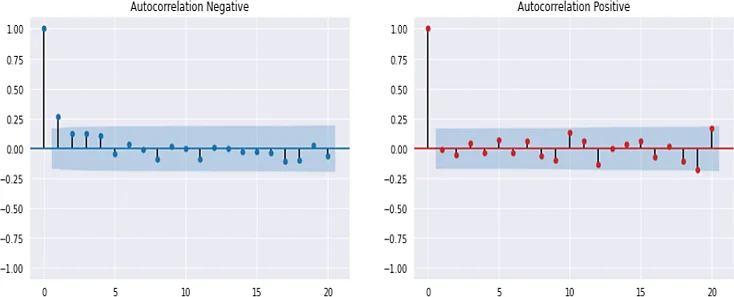
Fig. 7: Autocorrelation of positive and negative sentiments.
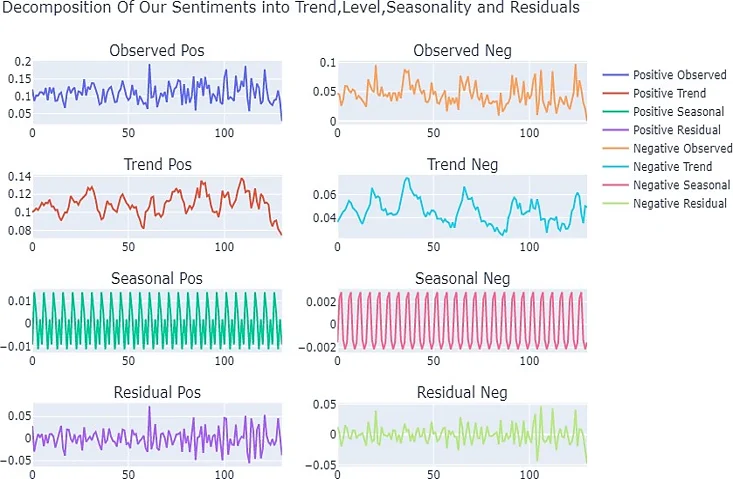
Fig. 8: Decomposition of sentiments into trends, level, seasonality, and residuals.
4.9 Day-to-day trend analysis results with events related to that specific date
Fig. 9 depicts the implementation of time series analysis with a graph that reflects the no of tweets per day over the dates. The X-axis represents the no of tweets every day, while the Y-axis represents the dates. The data is collected over five months, with each day having a specific quantity of tweets. Assume that on September 15, 2021, there are 139 tweets each day. We gathered recent news updates by comparing them with normal news material and utilizing trend analysis, which detects the peaks of Twitter activities. This time-based analysis has provided us with news information. The following is the latest news: (1) The committee suggested acquiring up to 300 million extra quantities of BioNTech-Pfizer vaccine, (2) The Vaccine was effective against a variant discovered in the UK, (3) Israeli study finds Pfizer vaccine 85 percent effective after the first shot, and (4) The Presidency of Joe Biden began, which displays the news on a specific day in these months.
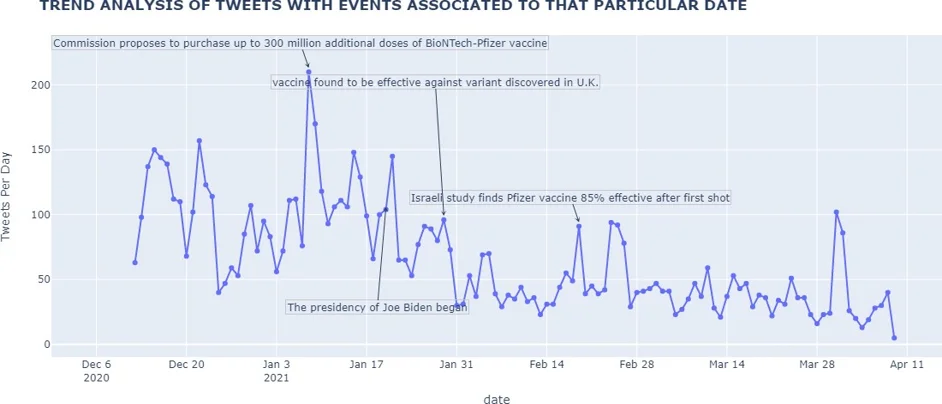
Fig. 9: Day-to-day trend analysis results with events related to that specific date.
4.10 Discussion
RQ1: Which is the best possible way to get ideal results for sentimental analysis classification?
The outcome acquired provokes the suitability of a systematic literature review (SRL). With a non-pre-judgmental approach, a simple comparison between different known machine learning and lexicon-based method has been conducted and as an outcome, it is concluded that the lexicon-based method scores better in most of our systematic literature review (SRL). A comparison model was recommended in various research papers.[12,31,35] Considering the results related to SRL (Systematic Literature Review) in segment 4.1, a meticulous approach is chosen and that is the VADER sentiment analyzer. VADER holds superiority as a conclusion of so far work. Hence this is the finest fitting method to execute the sentimental analysis. The results were further endorsed by the literature review results revealed in section 4.1, which classified training data as essential for using a machine learning approach. An algorithm will then be taught on this data to figure out and predict unidentified data classification. The analysis and testing of machine learning algorithms were extremely time-consuming creating a loss of motivation and focus for better results. So, we choose the VADER approach as a replacement for the machine learning method.[31]
RQ2: How do we manage the everyday sentiments distribution on top of the timeline series?
A graph representing the allocation of daily sentiments over the timeline of each partition, as displayed in the findings section 4.7 clarifies that the data is separated into three divisions primarily on the timeline of the COVID-19 vaccine. So, in section 4.7, the daily sentiments are allocated over the timeline series of every partition based on the mean and standard deviation (SD) values. However, when it comes to the model, there are some lags in the results. To correct these lags, a literature review is conducted on some research. So, by considering the literature study from Ref no(s) 7, 28, 29 and 30, It is concluded that autocorrelation analysis and seasonal decomposition should be used to repair lags in time-series models and to check for seasonal trends in our model. To demonstrate the results that are committed to defining the trends, level, seasonality, and residuals to monitor seasonal patterns of positive and negative sentiments and also to resolve the lags in the model, autocorrelation analysis, and decomposition of sentiments are performed. Finally, based on the findings in section 4.8, we may infer that our data is free of lags because there is a 95 percent confidence interval that confirms the same. The results are presented in the form of a graph that displays the values. Finally, the results of the daily trend analysis with events connected with certain dates are displayed in the 4.9 results section, which is a graph representing the number of tweets each day across five months of Twitter data from 2020 to 2021. This process can be completed by collecting five months' worth of tweets per day, as well as news and announcements from those months. By implementing this, we were able to find out the facts at that particular point in time. Several strategies were employed to discover any beneficial improvements and to make it easier to spot differences quickly.
6. Conclusion
A systematic literature review is undertaken in this study to determine the best possible strategy for performing sentimental analysis on the Coronavirus vaccination. There was sufficient data to conclude that VADER is a suitable method for sentimental analysis. As a result, the NLTK and the VADER analyzer were selected to perform a sentimental analysis of 14,500 messages on Twitter, which uses a multi-classification technique to analyze tweets. To express and reinforce sentiment intensity, VADER adopts grammatical and syntactical guidelines. The results reveal that the KDE distribution for each sentiment is i.e. neutral, negative, or positive depending on their sentiment levels. We may conclude from this study that humans response to sharing the sentiment on social media, especially on Twitter, transposes every day. This information about the COVID-19 vaccine epidemic reveals how individuals, government agencies, and social media outlets reported on the incident. In terms of time-series analysis, we can infer that by calculating standard deviation and mean values, we discovered various lags and patterns after executing the allocation of daily sentiments over each partition's timeline. Autocorrelation analysis is used to correct lags in the data, and we may also uncover trends, levels, seasonality, and residuals by analyzing the sentiments. The news on certain special days of our data has revealed more significant results in daily trend analysis with events related to the particular day. During the global outbreak of COVID-19, 140 million tweets were shared by people, organizations, and government agencies through Twitter. On social media platforms such as Twitter and Facebook, content is often buried beneath the noise, so extracting meaningful information from large amounts of noisy content is challenging, but once it is cleaned, this data reveals human feelings and emotions as well as expressions and thoughts. Analyzing it carefully provides a great deal of insight into the present moods, attitudes, and cultures of many human communities. In order to categorize the tweets’ sentiment, three types were identified (positive, negative, and neutral).
In this study, the following contributions are made:
- The purpose of this work is to identify a transformation-based multi-depth analyzer tool for sentiment analysis of tweets regarding the Coronavirus.
- Automated learning of features without being human-supervised by extracting concise sentiment information from tweets.
- Present an expansive examination between existing ML and DL message grouping strategies and examine the given gauge results. The proposed model beat on genuine datasets contrasted with all recently utilized strategies.
As social media tends to spread misinformation, health organizations need to develop reliable methods for detecting Coronavirus precisely in order to prevent false information from spreading. In comparison to similar studies of the same nature, the proposed approach performed very well on the given dataset and showed greater accuracy. The main focus of this article was the creation of a new dataset, rather than the efficient classification of users’ sentiments. Hence, we propose a VADER sentiment analyzer to categorize the user’s sentiments about COVID-19 based on their tweets. This study presents a clever structure that utilizes data from social media for grasping the public way of behaving during a significant troublesome occasion of the hundred years.
Acknowledgement
None.
Funding Declaration
This research did not receive any specific grant from funding agencies in the public, commercial, or not-for-profit sectors.
Data Availability Statement
The datasets generated and/or analyzed during the current study that support the findings are available from the corresponding author upon reasonable request.
Conflict of Interest
There is no conflict of interest.
Artificial Intelligence (AI) Use Disclosure
The authors confirm that there was no use of artificial intelligence (AI)-assisted technology for assisting in the writing or editing of the manuscript and no images were manipulated using AI. All technical content, experimental implementation, results, and interpretations were independently developed and verified by the authors.
Supporting Information
Not applicable.
References
- [1] S. Boon-It, Y. Skunkan, Public perception of the COVID-19 pandemic on Twitter: sentiment analysis and topic modeling study, JMIR Public Health and Surveillance, 2020, 6, e21978, doi: 10.2196/21978
- [2] J. Spencer, G. Uchyigit, Sentimentor: Sentiment analysis of twitter data, InSDAD@ ECML/PKDD, 2012, 56–66.
- [3] S. Elbagir, J. Yang, Twitter sentiment analysis using natural language toolkit and VADER sentiment, in Proceedings of the International Multiconference of Engineers and Computer Scientists, International Association of Engineers, 2019, 122, 13–15.
- [4] A. Agarwal, B. Xie, I. Vovsha, O. Rambow, R. Passonneau, Sentiment analysis of twitter data, in Proceedings of the Workshop on Language in Social Media (LSM 2011), Portland, Oregon, 2011, 30–38.
- [5] L. W. Heyerdahl, M. Vray, B. Lana, N. Tvardik, N. Gobat, M. Wanat, S. Tonkin-Crine, S. Anthierens, H. Goossens, T. Giles-Vernick, Conditionality of COVID-19 vaccine acceptance in European countries, Vaccine, 2022, 40, 1191–1197, doi: 10.1016/j.vaccine.2022.01.054
- [6] E. D. Liddy, Natural language processing, in Encyclopedia of Library and Information Science, 2nd ed., NY: Marcel Decker, Inc., 2001.
- [7] R. B. Cleveland, W. S. Cleveland, J. E. McRae, I. Terpenning, STL: A seasonal-trend decomposition, Journal of Official Statistics, 1990, 6, 3–73.
- [8] M. Alhajji, A. Al Khalifah, M. Aljubran, M. Alkhalifah, Sentiment analysis of tweets in Saudi Arabia regarding governmental preventive measures to contain COVID-19, 2020, doi: 10.20944/preprints202004.0031.v1
- [9] C. Kaur, A. Sharma, Twitter sentiment analysis on coronavirus using Textblob, EasyChair 2516-2314, 2020.
- [10] J. Ling, Coronavirus public sentiment analysis with BERT deep learning, 2020, Accessed 01 May 2025.
- [11] A. J. Nair, Veena G, A. Vinayak, Comparative study of twitter sentiment on covid-19 tweets, in 2021 5th International Conference on Computing Methodologies and Communication (ICCMC), IEEE, 2021, 1773–1778, doi: 10.1109/ICCMC51019.2021.9418320
- [12] C. Hutto, E. Gilbert, VADER: A parsimonious rule-based model for sentiment analysis of social media text, Proceedings of the International AAAI Conference on Web and Social Media, 2014, 8(1), 1, doi: 10.1609/icwsm.v8i1.14550
- [13] N. A. Sharma, A. S. Ali, M. A. Kabir, A review of sentiment analysis: tasks, applications, and deep learning techniques, International Journal of Data Science and Analytics, 2025, 19, 351–388, doi: 10.1007/s41060-024-00594-x
- [14] R. J. Medford, S. N. Saleh, A. Sumarsono, T. M. Perl, C. U. Lehmann, An “Infodemic”: leveraging high-volume twitter data to understand early public sentiment for the COVID-19 outbreak, Open Forum Infectious Diseases, 2020, 7, ofaa258, doi: 10.1093/ofid/ofaa258
- [15] C. K. Pastor, Sentiment analysis of Filipinos and effects of extreme community quarantine due to coronavirus (COVID-19) pandemic, Available at SSRN 3574385, 2020, https://papers.ssrn.com/sol3/papers.cfm?abstract_id=3574385, Accessed 03 May 2025.
- [16] A. Chopra, A. Prashar, C. Sain, Natural language processing, International Journal of Technology Enhancements and Emerging Engineering Research, 2013, 1, 131–134.
- [17] A. D. Dubey, Twitter sentiment analysis during COVID19 outbreak, 2020, Available at SSRN 3572023, https://europepmc.org/article/ppr/ppr385494, Accessed 07 May 2025.
- [18] K. A. Khan, M. A. Hossain, S. R. Rasel, M. Ohiduzzaman, F. Yesmin, L. Hassan, M. A. Salek, S. Z. Reza, A study on development of PKL power, in Computational Intelligence and Machine Learning: Proceedings of the 7th International Conference on Advanced Computing, Networking, and Informatics (ICACNI 2019), Singapore: Springer Singapore, 2020, 151–171, doi: 10.1007/978-981-15-8610-1_17
- [19] N. S. Yadav, V. Goar, Role of Metaverse in Pioneering Healthcare 4.0, in The Metaverse for the Healthcare Industry, Springer, Cham, 2024, doi: 10.1007/978-3-031-60073-9_10
- [20] V. K. Goar, N. S. Yadav, C. L. Chowdhary, P. Kumaresan, M. Mittal, An IoT and artificial intelligence-based patient care system focused on COVID-19 pandemic, International Journal of Networking and Virtual Organisations, 25, 232–251, doi: 10.1504/IJNVO.2021.120169
- [21] I. Roman, A. Mendiburu, R. Santana, J. A. Lozano, Sentiment analysis with genetically evolved Gaussian kernels, in Proceedings of the Genetic and Evolutionary Computation Conference, 2019, 1328–1337, doi: 10.1145/3321707.3321779
- [22] K. H. Manguri, R. N. Ramadhan, P. R. M. Amin, Twitter sentiment analysis on worldwide COVID-19 outbreaks, Kurdistan Journal of Applied Research, 2020, 54–65, doi: 10.24017/covid.8
- [23] K. Jahanbin, V. Rahmanian, Using twitter and web news mining to predict COVID-19 outbreak, Asian Pacific Journal of Tropical Medicine, 2020, 13, 378, doi: 10.4103/1995-7645.279651
- [24] T. Singh, M. Kumari, Role of text pre-processing in twitter sentiment analysis, Procedia Computer Science, 2016, 89, 549–554, doi: 10.1016/j.procs.2016.06.095
- [25] A. Krouska, C. Troussas, M. Virvou, The effect of preprocessing techniques on Twitter sentiment analysis, in 2016 7th International Conference on Information, Intelligence, Systems & Applications (IISA), IEEE, 2016, 1–5, doi: 10.1109/IISA.2016.7785373
- [26] C. Gallagher, E. Furey, K. Curran, The application of sentiment analysis and text analytics to customer experience reviews to understand what customers are really saying, International Journal of Data Warehousing and Mining, 2019, 15, 21–47, doi: 10.4018/IJDWM.2019100102
- [27] E. M. Younis, Sentiment analysis and text mining for social media microblogs using open-source tools: an empirical study, International Journal of Computer Applications, 2015, 112, doi: 10.5120/19665-1366
- [28] W. McKinney, J. Perktold, S. Seabold, Time series analysis in Python with statsmodels, Python in Science Conference, Jarrodmillman Company, 2011, 107–113, doi: 10.25080/Majora-ebaa42b7-012.
- [29] J. R. Bence, Analysis of short time series: Correcting for autocorrelation, Ecology, 1995, 76, 628–639, doi: 10.2307/1941218
- [30] A. Pal, P. K. S. Prakash, Practical Time Series Analysis: Master Time-Series Data Processing, Visualization, and Modeling Using Python, Packt Publishing Ltd, 2017.
- [31] M. Gustafsson, M. Davidsson, Sentiment analysis for tweets in Swedish, Bachelor Degree Project, 2020.
- [32] R. K. Botchway, A. B. Jibril, M. A. Kwarteng, M. Chovancova, Z. K. Oplatkov, A review of social media posts from UniCredit bank in Europe: a sentiment analysis approach, in Proceedings of the 3rd International Conference on Business and Information Management (ICBIM ’19), Paris, France, 2019, 74–79, doi: 10.1145/3361785.3361814
- [33] V. Bonta, N. K. N. Janardhan, A comprehensive study on lexicon-based approaches for sentiment analysis, Asian Journal of Computer Science and Technology, 2019, 8, 1–6.
- [34] V. D. Chaithra, Hybrid approach: Naive Bayes and sentiment VADER for analyzing sentiment of mobile unboxing video comments, International Journal of Electrical and Computer Engineering, 2019, 9, 4452, doi: 10.11591/ijece.v9i5.pp4452-4459
- [35] A. Borg, M. Boldt, Using VADER sentiment and SVM for predicting customer response sentiment, Expert Systems with Applications, 2020, 162, 113746, doi: 10.1016/j.eswa.2020.113746
Publisher Note
The views, statements, and data in all publications solely belong to the authors and contributors. GR Scholastic is not responsible for any injury resulting from the ideas, methods, or products mentioned. GR Scholastic remains neutral regarding jurisdictional claims in published maps and institutional affiliations.
Open Access
This article is licensed under a Creative Commons Attribution-NonCommercial 4.0 International License, which permits the non-commercial use, sharing, adaptation, distribution and reproduction in any medium or format, as long as appropriate credit to the original author(s) and the source is given by providing a link to the Creative Commons License and changes need to be indicated if there are any. The images or other third-party material in this article are included in the article's Creative Commons License, unless indicated otherwise in a credit line to the material. If material is not included in the article's Creative Commons License and your intended use is not permitted by statutory regulation or exceeds the permitted use, you will need to obtain permission directly from the copyright holder. To view a copy of this License, visit: https://creativecommons.org/licenses/by-nc/4.0/
© The Author(s) 2025