

 Open Access||Review Article
Geospatial Artificial Intelligence for Safer Cities: Mapping and Predicting the Geography of Crime in India
S. Balaselvakumar1 , P Mary Santhi2
1 Department of Geography, Government Arts College, Tiruchirappalli, Tamil Nadu, 620 022, India
2 St. Patrick's Junior College, Agra, Uttar Pradesh, 282002, India
Abstract
Predictive policing and geospatial artificial intelligence (GeoAI) are being increasingly used to analyze crime geography, yet evidence from India remains fragmented across geography, criminology, computer science, and public administration. This systematic review addresses fragmentation by synthesizing 29 evidence units drawn from 46 publications, including one sustained 18-publication single-city program, and by situating Indian evidence within international GeoAI and spatial-criminology research. Existing approaches are limited by the predominance of retrospective, single-city hotspot mapping; heterogeneous and noncomparable evaluation metrics; limited independent validation of predictive systems; weak reporting of explainability and data provenance; and minimal integration of environmental and climate variables. A PRISMA-informed search of six databases, supplemented by citation and snowball tracking, was used to identify, screen, and appraise the evidence. The synthesis compares kernel density estimation, Getis-Ord Gi*, Moran’s I, risk-terrain modeling, and machine-learning/deep-learning approaches across local, district, state, national, and international contexts. The review reveals that the spatial concentration of crime is consistently reported in Indian studies that test for clustering, whereas a recent Indian machine-learning study reports 93.20% accuracy but lacks independent replication and sufficiently harmonized validation. The Delhi Crime Mapping, Analytics and Predictive System (CMAPS) case also demonstrates how reporting and data-provenance mechanisms can shape place-based predictive risk. The principal contribution is an integrated evidence framework that separates descriptive spatial evidence from predictive claims, makes the study-selection and quality-assessment procedures explicit, and identifies six research priorities: harmonized data infrastructure, bias auditing, place-based modeling, climate-crime integration, cross-state benchmarking, and independent evaluation. These findings provide a methodological basis for developing more transparent, reproducible, and context-sensitive GeoAI research on crime in India.
Keywords
Graphical Abstract
Novelty Statement
This systematic review synthesizes fragmenting literature on Indian predictive policing and GeoAI, offering an integrated framework that separates descriptive spatial crime data from unvalidated machine-learning predictive claims. It establishes six strategic research priorities—including bias auditing and climate-crime integration—to transition the field from fragmented, single-city hotspot mapping toward transparent, reproducible, and context-sensitive spatial criminology.
1.1 Background and Significance
Crime does not distribute itself evenly across territories. This observation, first formalized by the Chicago School's mapping of juvenile delinquency in the 1920s and later systematized through routine activity theory, has since matured into an entire subdiscipline: environmental criminology, in which the built and social environment, not only the offender, is treated as a legitimate unit of analysis. [1] Over the past two decades, this geographic tradition has converged with two parallel technical revolutions. The first is the maturation of geographic information systems (GIS) into a standard analytical infrastructure for public administration, enabling kernel density estimation and spatial autocorrelation statistics such as Moran's I and Getis-Ord Gi* and risk-strain modeling to move from academic demonstration to routine police practice.[2] The second is the rise of artificial intelligence, machine learning, deep learning, and, most recently, spatially explicit "GeoAI" architectures purpose-built to respect spatial statistical peculiarities.[3] India presents a distinctive and underexamined setting in which to study this convergence. It is simultaneously home to one of the world's largest and fastest-digitizing police data infrastructures, the Crime and Criminal Tracking Network & Systems (CCTNS), which links police stations nationwide, and to acute constraints on data quality, institutional transparency, and rural connectivity that do not feature prominently in the largely North American and European literature that dominate the field.[4] Delhi Police's Crime Mapping, Analytics and Predictive System (CMAPS), launched in 2015, was among the earliest non-Western predictive-policing deployments worldwide but remains one of the least independently evaluated, owing to broad law-enforcement exemptions under India's Right to Information Act.[4] At the same time, a growing body of Indian academic work spanning Pune,[5] West Bengal,[6,7] Rajasthan,[8,9] Haryana[10] and Kerala (studies reviewed in Section 3) has applied GIS and, increasingly, machine-learning methods to subnational crime geography, largely without reference to one another or to the international predictive-policing debate. This fragmentation has substantive implications because predictive systems can inherit biases from the data and institutional processes on which they depend. International evidence has documented bias associated with historically uneven policing and reporting, while Indian evidence remains much less independently evaluated. The Indian context also differs in terms of administrative structure, data practices, reporting behavior, and social geography. Consequently, findings from North American or European deployments cannot simply be transferred to India without an examination of the India-specific evidence base. A systematic synthesis is therefore needed to distinguish what has been empirically established in India from emerging evidence, methodological limitations, and research hypotheses.
1.2 Definition of Key Concepts
Geospatial artificial intelligence (GeoAI) is defined, following Janowicz et al. (2020), as the application of artificial intelligence techniques, principally machine learning and deep learning, in a manner that is explicitly spatially aware: spatial autocorrelation (the tendency of nearby locations to resemble one another), the modifiable areal unit problem (the sensitivity of results to the scale and boundaries of spatial aggregation), and spatial heterogeneity (the tendency of relationships to vary across geographic space rather than hold uniformly).[3] Crime hotspot mapping refers to techniques, principally kernel density estimation (KDE), that convert discrete crime incident points into a continuous density surface, visually identifying areas of elevated concentration.[2] Spatial autocorrelation statistics, notably global and local Moran's I and the Getis–Ord Gi* statistic, formally test whether observed spatial clustering is statistically significant rather than an artifact of random variation (Getis & Ord, 1992).[5] Risk-strain modeling (RTM) involves layers of independent environmental risk factors, proximity to transit, licensed premises, and vacant structures, to model why a location carries elevated risk, in contrast to hotspot mapping's purely retrospective description of where crime has previously occurred. Predictive policing denotes the operational use of any of the above techniques, typically machine-learning-based, to forecast future crime risk and to guide the deployment of police resources.[11]
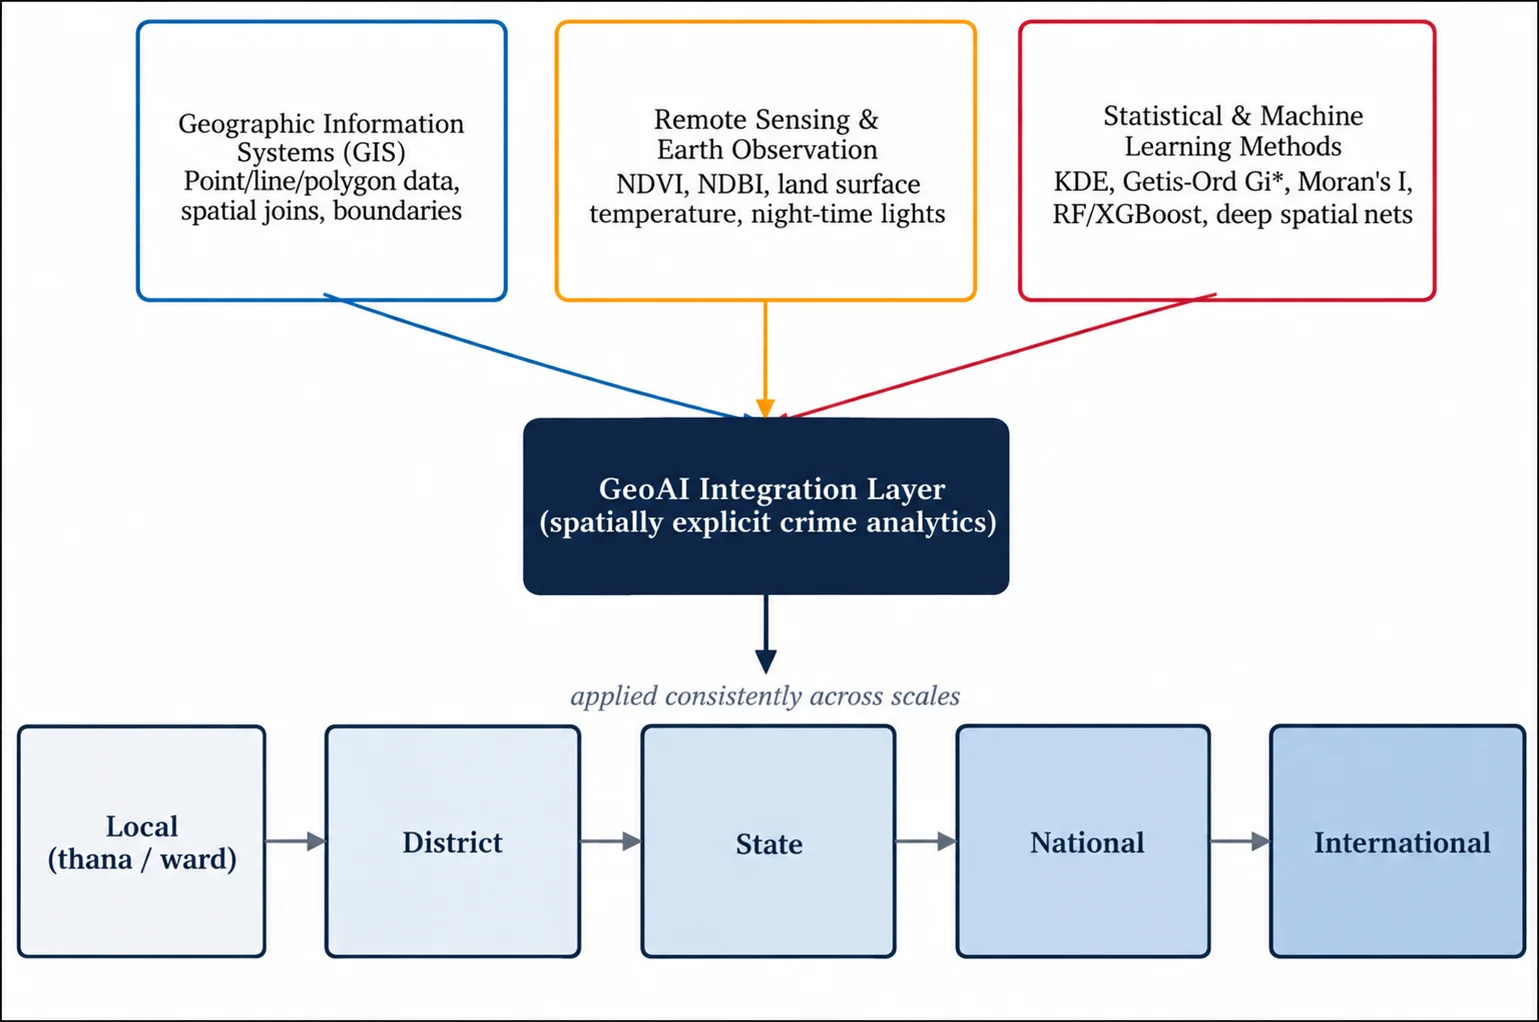
Fig. 1: Conceptual framework linking GeoAI data and method inputs to a nested, multiscalar structure of crime analysis, from local wards to international comparison. This framework structures the scale-based synthesis presented in Sections 3 and 4.
1.3 Research Questions and Objectives
Despite the accelerating pace of publication in this field, no existing review synthesizes the Indian evidence base specifically, compares it systematically against international predictive-policing experience, or evaluates it against a common standard of methodological quality. This review is guided by one central research question, disaggregated into three subquestions:
Central research question: How have GIS-based and AI-enabled (GeoAI) methods been applied to map, analyze, and predict the geography of crime in India, and how does this body of evidence compare, in method, data quality, and equity outcome, across local, district, state, national, and international contexts?
RQ1. What methodological approaches dominate the Indian crime-geography literature, and how have they evolved from descriptive GIS mapping toward predictive GeoAI?
RQ2. How do the accuracy, transparency, and equity of India-specific systems compare with those of international predictive-policing deployments and their documented outcomes?
RQ3. What methodological, data, and ethical gaps most urgently constrain robust, fair GeoAI deployment for crime prevention in India, and what research agenda follows from them?
In pursuit of these questions, the review develops and applies the conceptual framework shown in Fig. 1, which organizes the evidence according to two orthogonal dimensions: the technical input used (GIS, remote sensing, or statistical/machine-learning method) and the geographic scale at which it is applied (local through international). This framework, rather than a simple chronological literature summary, structures the Results and Discussion sections that follow.
1.4 Research Gap and Contributions
Four contributions distinguish this review. First, it consolidates 29 evidence units drawn from 46 publications and organizes them across five geographic scales, reducing fragmentation created by disciplinary and location-specific studies. Second, it provides an explicit and reproducible study-selection account, including the supplementary search, duplicate handling, full-text exclusions, and treatment of the Tiruchirappalli multi-report programme. Third, it introduces a common comparison structure covering dataset provenance, features, modeling approach, temporal modeling, explainability, application, findings, and limitations, while separately appraising design clarity, data transparency, validation rigour, bias/fairness discussion, and replicability. Fourth, it distinguishes established descriptive evidence from emerging predictive evidence and untested research hypotheses and translates the resulting gaps into six research priorities relevant to practical crime mapping, predictive-system auditing, environmental integration, and cross-state benchmarking.
1.5 Real-World Implications
The practical relevance of the synthesis lies in the range of decisions that spatial crime analysis may inform. At the local level, validated hotspot maps can support the spatial prioritization of patrol attention and public safety resources. At the system level, data-provenance audits can examine whether emergency calls, FIR records, or other administrative inputs systematically represent some places more strongly than others do. At the research and planning level, the identified gap in remote-sensing and climate variables provides a basis for testing whether flood exposure, land-surface temperature, night-time activity, vegetation, or seasonal population movement can improve place-based understanding without being mistaken for evidence of causality. At broader scales, harmonized metrics and common validation protocols could support comparisons among cities and states and make independent evaluation of operational systems more feasible. These applications are presented as potential uses of the evidence base rather than as demonstrated effects of the reviewed systems.
2.1 Search Strategy and Databases
This review followed a search and screening protocol informed by the Preferred Reporting Items for Systematic Reviews and Meta-Analyses (PRISMA) framework, adapted for mixed technical–social-science literature spanning geography, computer science, criminology, and public administration (Fig. 2). Structured searches were conducted across Scopus, Web of Science, IEEE Xplore, ScienceDirect, SpringerLink, and Google Scholar. These sources were selected to cover geospatial science, computer science, criminology, and multidisciplinary publishing venues. The search strings combined three Boolean concept blocks: (i) a geography/technique block ("GIS" OR "geospatial" OR "GeoAI" OR "remote sensing" OR "spatial analysis"); (ii) a crime block ("crime" OR "crime mapping" OR "predictive policing" OR "hotspot"); and (iii) a context block ("India" OR named Indian states/cities). The context block was relaxed for searches intended to identify international comparators and foundational methodological literature. The searches covered records published between January 2000 and August 2026. The search results were exported for deduplication, screened at the title/abstract level, and then assessed at full-text level against the predefined eligibility criteria. Citation and snowball tracking was subsequently used to identify relevant records not retrieved by the database queries.
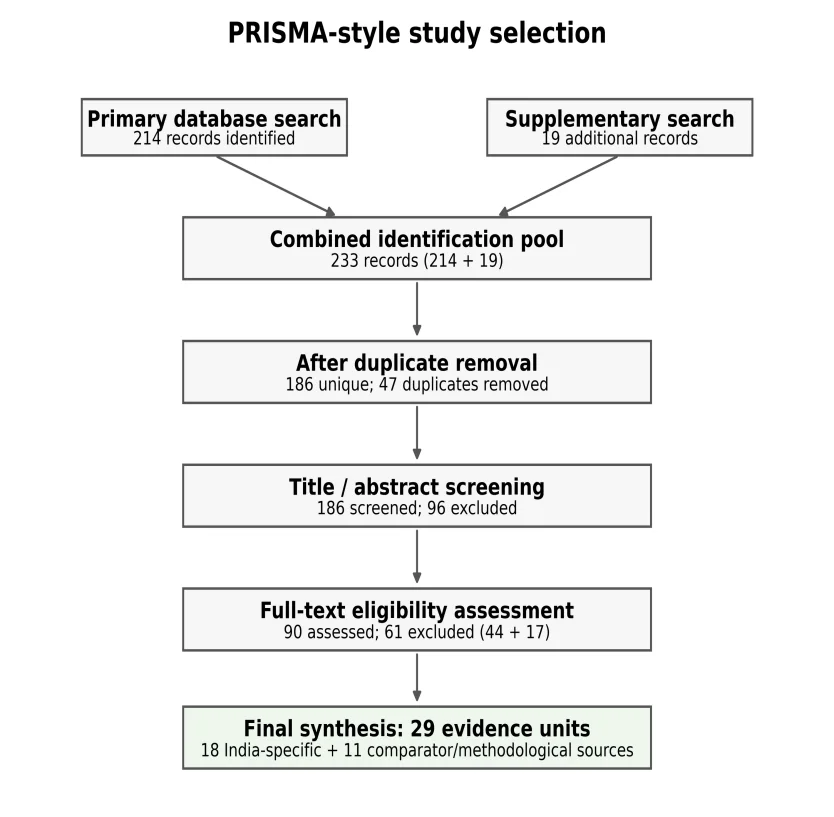
Fig. 2: PRISMA-style flow diagram showing database identification, supplementary citation/snowball retrieval, duplicate removal, title/abstract screening, full-text eligibility assessment, and final inclusion.
2.2 Inclusion and Exclusion Criteria
Records were included when they (a) reported an empirical application of a GIS-based, remote-sensing-based, spatial-statistical, or machine-learning/deep-learning method to crime data; (b) were set in India or were international studies selected as methodological or comparative benchmarks explicitly cited by the Indian literature; and (c) provided sufficient methodological detail on the data source, spatial unit, analytical technique, and at least one outcome or finding to support quality appraisal. Records were excluded if they were purely theoretical or opinion pieces without empirical spatial analysis, addressed crime-adjacent outcomes without methodological transferability, duplicated or substantially overlapped a dataset represented by an included evidence unit, or were inaccessible in sufficient detail, such as abstract-only records without a retrievable methods section. The same eligibility rules were applied to records identified through the supplementary citation and snowball search.
2.3 Study Selection Process
An initial 214 records were identified through the six primary databases/search sources. A supplementary citation- and snowball-tracking search identified 19 additional records. Thus, 233 records were entered into the combined identification pool. After 47 duplicate records were removed, 186 unique records remained for title and abstract screening. At this stage, 96 records were excluded because they were off-topic, nonempirical, or lacked India-specific or justified comparative relevance. Ninety full-text records were then assessed for eligibility. Sixty-one full-text records were excluded: 44 lacked a distinct spatial/GeoAI method or sufficient methodological reporting, and 17 were duplicate or overlapping-dataset reports that did not constitute independent evidence units. The final synthesis therefore contains 29 evidence units: 18 India-specific empirical evidence units, including one consolidated Tiruchirappalli program reported across 18 linked publications, and 11 international comparator, foundational-theory, or methodological-review sources. The notation "n = 19" refers only to the number of additional records retrieved through citation and snowball tracking; it does not refer to the number of included studies, datasets, or participants.
2.3.1 Handling of the Tiruchirappalli Multi-Report Programme
Between 2018 and 2021, P. M. Santhi, S. Balaselvakumar, and K. Kumaraswamy published eighteen linked papers analyzing crime in Tiruchirappalli city, Tamil Nadu, using geoinformatics and geostatistical methods. A cross-referencing of the reported study periods, study areas, and data sources indicates that most of these publications draw on a shared, overlapping underlying dataset of city police records, predominantly covering approximately 2012–2017, analyzed through different thematic lenses, including major crimes, crimes against women, socioeconomic profiling of offenders, temporal and seasonal variation, criminal residence location, and subcity police-range breakdowns. Counting all eighteen publications as independent studies would create a unit-of-analysis problem because a single city and underlying dataset would be overweighted relative to the rest of the Indian evidence base. Following standard evidence-synthesis practices for multiple reports of one underlying study, the program is therefore treated as one included evidence unit reported across eighteen linked publications. The eighteen linked publications are treated as one evidence unit; three representative publications are retained in the reference list and are cited for the thematic dimensions discussed in Section 3.
2.4 Data Extraction and Quality Assessment
For each included evidence unit, the extraction form recorded author(s) and year; geographic scale and location; data source and time period; analytical method(s); reported outcome metric(s); and any explicitly discussed limitation, bias, or ethical consideration. The extraction also recorded, where reported, input features, temporal modeling, explainability/interpretability, validation design, and application objective. Because the literature spans disciplines with materially different reporting norms, geospatial studies commonly report spatial agreement statistics, whereas computer-science studies commonly report classification metrics, no single quantitative outcome metric was common to all evidence units. A structured narrative synthesis was therefore combined with a semiquantitative appraisal of five quality dimensions: (i) clarity of study design and spatial unit; (ii) transparency of data provenance and acknowledged sampling bias; (iii) validation or ground-truthing rigour; (iv) engagement with bias, fairness, or ethical risk; and (v) replicability, based on the availability of data, code, or sufficient parameter detail. Each primary empirical evidence unit was rated high, moderate, or limited on each dimension from the published methods and results. The resulting appraisal is reported in Table 1.
Table 1: Reviewers' appraisal of the quality assessment of eight representative primary studies across five dimensions (high/moderate/limited)
| Study | Design Clarity | Data Transparency | Validation Rigour | Bias/Fairness Discussion | Replicability |
|---|---|---|---|---|---|
| [4] | High | High | N/A (audit, not model) | High | Moderate |
| [12-14] | Moderate | Limited | Limited | Limited | Limited |
| [5] | High | Moderate | Moderate | Limited | Limited |
| [6,7] | High | Moderate | Moderate | Moderate | Limited |
| [8] | Moderate | Moderate | Limited | Limited | Limited |
| [9] | Moderate | Moderate | Limited | Limited | Limited |
| [10] | Moderate | Moderate | Limited | Limited | Limited |
| [15] | Moderate | Limited | High | Limited | Limited |
2.5 Evidence Base and Dataset Provenance
This article presents a systematic review rather than a primary crime-prediction experiment; consequently, no new crime dataset was collected or generated by the authors. The review evidence consists of study-level information extracted from the included publications. The principal Indian data sources represented in the corpus are police station records, state crime records, CCTNS/FIR records, Dial-100 emergency-call records, and an Indian crime dataset covering 2020–2024 used by one recent machine-learning study. The source material does not provide a complete machine-readable data dictionary or a stable public repository for that 2020–2024 machine-learning dataset; therefore, the review does not infer a record count, exact field list, or precise preprocessing pipeline beyond what the source study reports. This limitation is made explicit rather than filling missing metadata with assumptions. Official National Crime Records Bureau (NCRB) Crime in India reports can be viewed through the NCRB website, and NCRB datasets are also discoverable through the Government of India Open Government Data (OGD) Platform.[16,17]
2.6 Note on Meta-Analytic Approach
A formal quantitative meta-analysis, pooling effect sizes into a single weighted estimate, was considered but judged inappropriate because the included studies use heterogeneous outcome metrics, including predictive accuracy, F1 score, spatial pattern agreement, the predictive accuracy index, and qualitative hotspot concordance. These metrics are not mathematically interconvertible without underlying confusion matrices or harmonized spatial validation outputs, which most included studies do not publish. The lack of a common outcome metric is therefore treated as a substantive finding of the review. Comparable values are reported narratively and visually in Fig. 3 as an illustrative, nonpooled synthesis, and the distinction between reported performance and cross-study comparability is maintained throughout.
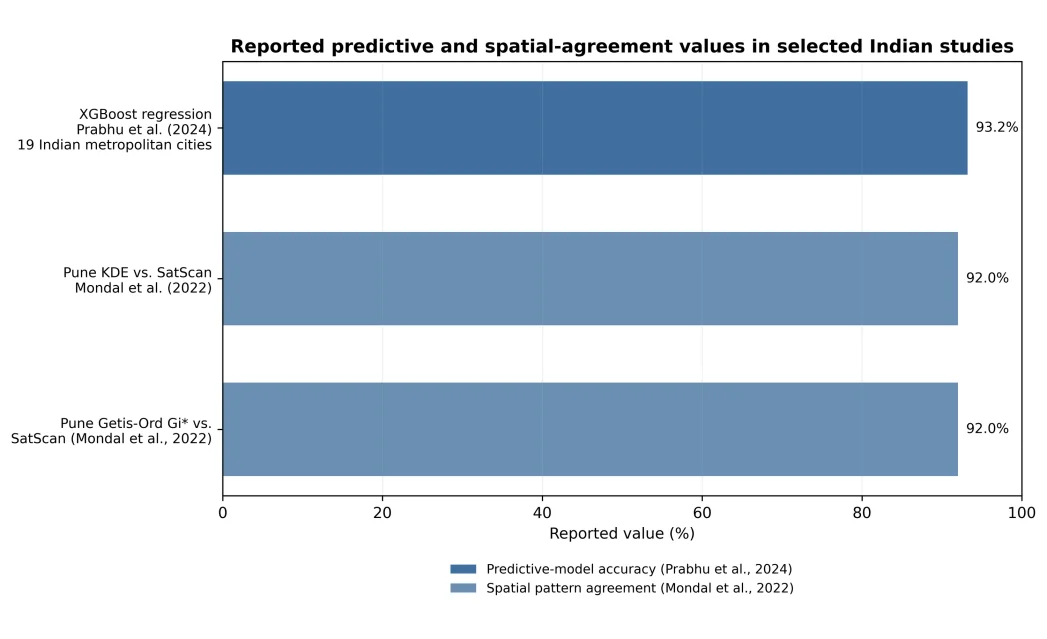
Fig. 3: Reported predictive and spatial agreement values are not methodologically comparable (different metrics, datasets, and validation designs) and are shown for illustrative synthesis only; see Section 4.3 for a critical assessment of cross-study comparability.
3. Results
The 29 included evidence units span 2000–2026, although 23 of 29 were published from 2017 onward, reflecting recent acceleration. Table 2 presents thirteen methodologically representative studies selected to illustrate the range of datasets, features, methods, temporal modeling, explainability, geographic scales, and reported limitations in the corpus. Geographically, India-specific evidence is concentrated in a small number of cities and states (Fig. 4). At the independent-evidence-unit level, Tiruchirappalli, Delhi, and West Bengal are the most intensively represented locations, whereas Pune, Thiruvananthapuram, Aurangabad, Ajmer, Jodhpur, Thrissur, and Haryana each contribute one evidence unit. At the raw-publication level, the Tiruchirappalli program accounts for eighteen linked publications, illustrating the effect of a sustained single-city research program on publication volume. No India-specific evidence unit was identified in the Northeast, Chhattisgarh or Madhya Pradesh, or in a smaller Tier-3 city or rural nonmetropolitan district outside Tamil Nadu. Methodologically, the corpus is divided into two eras, visualized in Fig. 5. Studies published before approximately 2020 rely almost exclusively on descriptive and first-generation inferential spatial statistics: Kernel Density Estimation, Getis-Ord Gi* and Moran's I applied to police-reported incident data at the city or district scale (e.g., Kannan, 2017[8]; Lama & Rathore, 2017[9]; Sukhija et al., 2017[10]; Mondal et al., 2022[5]). Studies published from approximately 2023 onward increasingly adopt machine-learning and deep-learning architectures – random forest, XGBoost, support vector machines, and long short-term memory networks – often in hybrid combinations and report classification- or regression-style performance metrics rather than spatial-agreement statistics. A verified Indian example is Prabhu et al. (2024), who evaluated five machine-learning models using National Crime Records Bureau data from 19 metropolitan cities. [15,16]
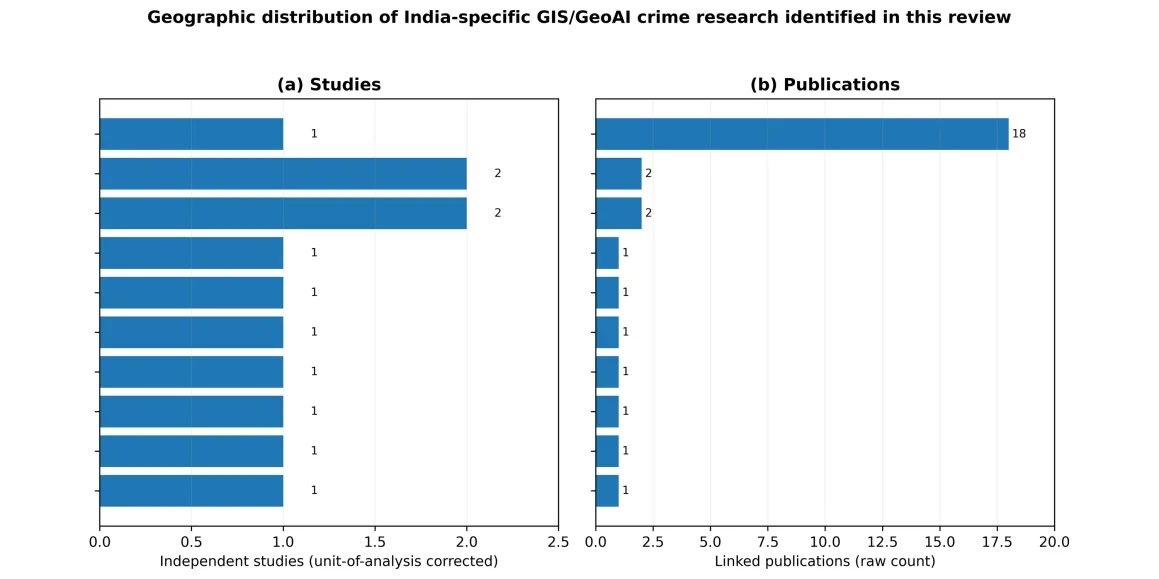
Fig. 4: Subnational concentration of India-focused spatial crime research identified in the review, illustrating pronounced urban and western/southern-state bias.
Table 2: Comparative literature matrix for the thirteen methodologically representative studies included in this review
| Study | Dataset | Features | Model/Method | Temporal Modeling | Explainability | Application/Objective | Key Findings | Limitations |
|---|---|---|---|---|---|---|---|---|
| [4] | Delhi Dial-100 calls, CCTNS FIRs, CMAPS outputs | Call volume/location and FIR-related inputs; exact field list not reported | Ethnographic and data-provenance audit of an operational system | Not a forecasting experiment; operational time handling not fully reported | Qualitative transparency/data-provenance analysis; no model-level XAI | Assess data provenance and representational effects in CMAPS | Reporting behavior differed across neighborhoods and could shape predicted place-based risk | Single operational case; no independent predictive-accuracy or causal crime-reduction evaluation |
| [12-14] | Tiruchirappalli city police records, predominantly 2012–2017, across 18 linked publications | Crime type, police range, temporal/seasonal variation, offender socioeconomic attributes, residence | Descriptive geoinformatics, concentration scores, GIS mapping and profiling | Descriptive temporal/seasonal analysis; no forward prediction | Maps and descriptive statistics are directly interpretable; no formal model-XAI reported | Characterize spatial, temporal, and socioeconomic dimensions of crime within one city | Consistent evidence of concentration and socioeconomic/temporal associations | Shared underlying dataset; no reported Moran's I/Getis-Ord Gi* testing in the programme; heterogeneous publication venues |
| [5] | Pune police-station records, 2012–2015 | Crime type, location and time; four crime types highlighted | KDE, Getis-Ord Gi*, Space–Time Permutation Model | Explicit space-time cluster detection | Spatial-statistical outputs provide interpretable hotspot evidence | Compare hotspot and space-time detection methods | 92% spatial agreement and 26 significant space-time clusters | City specific; metric and spatial-unit comparability with other studies remains limited |
| [7] | West Bengal state crime records | District/locality and crime-category variables as reported in the source | GIS and statistical modeling of crime hotspots | Future-hotspot orientation reported; exact temporal specification not fully described here | Statistical/GIS outputs interpretable; no dedicated XAI framework reported | Identify spatial patterns and future crime hotspots | Distinct spatial patterning of crimes against women across districts | Source-level details on features, validation, and reproducibility are limited in the review record |
| [6] | Survey and police records, West Bengal | Locality-level and domestic-violence-related variables | Logistic regression with spatial analysis | Temporal modeling not central to the reported analysis | Regression coefficients provide conventional statistical interpretability | Assess locality-level variation in domestic-violence risk | Risk varies systematically with locality-level factors | Transferability beyond study setting and cross-city validation are limited |
| [8] | Ajmer City local police records | Crime type/location; property-crime context | GIS hotspot mapping | Retrospective spatial description | KDE/GIS outputs are visually interpretable | Identify property-crime hotspots | Significant clustering near commercial nodes | Limited predictive validation and city-specific data |
| [9] | Jodhpur police records | Property crime, land-use and transit-access context | Crime mapping and spatial analysis | Retrospective spatial analysis | Map-based interpretation; no model-level XAI reported | Relate property crime to urban land use and accessibility | Property crime clustered strongly with land-use and transit access | Limited formal predictive validation and generalisability |
| [10] | Haryana state police data | Cognizable crime categories and geography | Spatial visualization of crime hotspots | Retrospective state-level mapping | Direct visual interpretability | Identify state-wide hotspot patterns relevant to resource allocation | Hotspot identification demonstrated at state scale | No predictive validation or harmonized cross-state benchmark |
| [15] | 19 Indian metropolitan cities; NCRB data | Crime categories, city/year variables | Nearest neighbor, SVM, RF, decision tree, XGBoost | Historical-data prediction; exact temporal holdout not reported | Model-level interpretability not a focus | Predict crime rates across eight categories in 19 metropolitan cities | XGBoost reported 93.20% accuracy; cross-city transfer and independent validation remain limited | Source metadata, feature list, dataset size and independent temporal/spatial validation are insufficiently reported for replication |
| [18] | 134 primary ML/DL crime-prediction studies | Review-level extraction of datasets, algorithms and evaluation practices | Systematic review | Varied across primary studies | Review identifies explainability as a weakness | Synthesize ML/DL crime-prediction methods and gaps | ML/DL adoption is accelerating; explainability and transfer validity remain weak | Heterogeneity of primary studies limits pooled inference |
| [19] | 293 primary GIS urban-crime studies | GIS methods, spatial units, crime contexts | Systematic literature review | Varied across primary studies | Ethical/explainability reporting reviewed qualitatively | Review evolution of GIS applications in urban crime analysis | Field is moving toward AI integration while ethical scrutiny lags technical development | English/database coverage and heterogeneity of primary literature |
| [21] | 36 qualifying English-language remote-sensing crime studies | Vegetation indices, land-surface temperature, night-time lights and other satellite-derived variables | Systematic review | Varied; environmental covariates used as contextual predictors in primary studies | Remote-sensing variables can be mapped/interpreted, but model explainability varies | Assess use of remote sensing in urban crime analysis | Research is concentrated overwhelmingly in the United States, with limited Global South representation | English-language restriction and limited India-specific evidence |
| [20] | 32 rigorous studies from 786 screened | Spatial forecasting methods and evaluation measures | Systematic review of spatial crime forecasting | Temporal forecasting is central across included studies | Review-level; methodological transparency varies | Assess spatial crime forecasting approaches | Hotspot-style binary classification remains dominant | Few common evaluation standards; primary-study heterogeneity limits direct comparison |
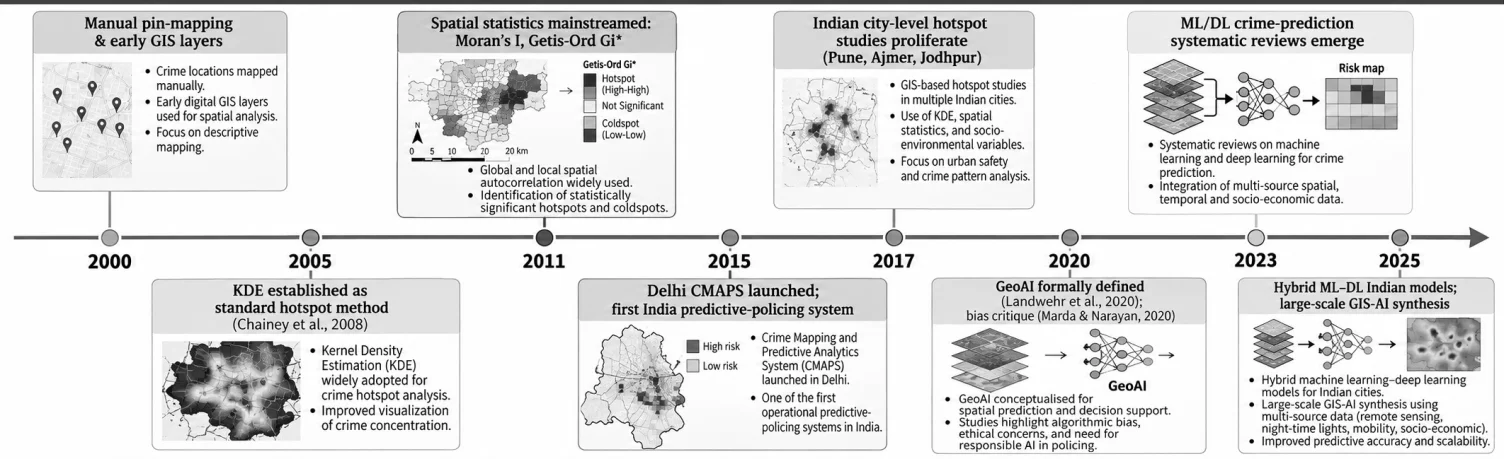
Fig. 5: Timeline of methodological evolution in spatial and GeoAI-based crime analysis, globally and in India, based on the studies identified in this review.
3.2 Categorization of Methodological Approaches
Following the conceptual framework in Fig. 1, the included studies were classified into four nonexclusive methodological categories:
Descriptive spatial mapping (n = 9): studies applying KDE, Getis-Ord Gi*, and/or Moran's I to identify and visualize crime hotspots, typically at the city scale, with no forward-looking predictive claim (e.g., Kannan, 2017[8]; Lama & Rathore, 2017[9]; Thiruvananthapuram and Thrissur GIS studies).
Comparative spatial-statistical evaluation (n = 3): Studies explicitly benchmarking multiple spatial techniques against one another, most notably Mondal et al. (2022), who compared the space–time permutation model against KDE and Getis-Ord Gi* in Pune and reported 92% pattern agreement between methods.[5]
Operational predictive-policing case studies (n = 2): In-depth institutional studies of a deployed system, dominated in this review by Marda and Narayan's (2020) ethnographic and data-bias analysis of Delhi's CMAPS.[4]
Machine-learning/deep-learning prediction (n = 6): studies training supervised or hybrid models on historical crime records to forecast future incidence, typically reporting classification or regression performance. A verified Indian example uses National Crime Records Bureau data from 19 metropolitan cities and evaluates nearest-neighbor, support vector machine, random forest, decision-tree, and XGBoost models.[15-17]
Sociodemographic and temporal offender profiling (n = 1 study, reported across 18 linked publications): The Tiruchirappalli, Tamil Nadu programme, represented here by complementary reports on crime against women, offender socioeconomic characteristics, and temporal/seasonal variation, is the only study identified in this review to systematically extend spatial crime mapping to these dimensions within a single city (Section 3.3.5).[12-14]
The remaining sources are foundational theoretical works,[1] global systematic reviews used for methodological benchmarking,[18-22] and policy-analytic literature on the ethical dimensions of predictive policing.[11]
3.3 Summary of Main Findings by Theme
The following subsections summarize the main findings across five thematic areas identified in the corpus.
3.3.1 Spatial Concentration is a Robust, Replicated Finding
Every India-specific study reviewed that tested for spatial clustering found a statistically significant concentration of crime incidents, regardless of the city, crime type, or specific statistical test used. In Pune, the four crime types (robbery, molestation, rape, and dacoity) analyzed from 2012–2015 produced 26 statistically significant clusters according to the space–time permutation model, with the most significant subset achieving a predictive accuracy index above 57.[5] In Thiruvananthapuram, an analysis of 2,974 crime cases from 2010–2014, including 60 murders and 388 robberies, revealed significant hotspots and cold spots using Moran's I and Getis-Ord Gi*. This consistency across at least six distinct Indian urban contexts represents one of the more empirically settled findings in the reviewed literature, and it is consistent with the broader international finding that crime is concentrated in a small proportion of places.
3.3.2 Machine-Learning Accuracy Claims are High but Not Independently Comparable
Recent Indian machine-learning studies report promising predictive performance, but their metrics are not directly comparable across study designs. Prabhu et al. (2024) reported 93.20% accuracy for an XGBoost regression model using National Crime Records Bureau data covering eight crime categories across 19 Indian metropolitan cities.[15-16] This value is not methodologically comparable to the 92% spatial pattern agreement values reported by Mondal et al. (2022) because the former is a predictive-model performance metric, whereas the latter measures spatial concordance between independently derived hotspot surfaces.[5] This distinction is central to why this review does not attempt a pooled quantitative meta-analysis.
3.3.3 The Single Operational Deployment Studied Shows Documented Representational Bias
Marda and Narayan's (2020) study of Delhi's CMAPS remains the only in-depth, India-specific academic analysis of an operational predictive-policing system available in the literature reviewed here.[4] Their ethnographic and data-provenance analysis revealed that the CMAPS draws on two structurally biased input streams – Dial-100 emergency calls and CCTNS FIR records – and that Delhi Police personnel reported that calls from affluent neighborhoods were relatively rare ("posh areas hardly called", in the words of staff interviewed), while an "overwhelming majority" of calls originated from informal settlements. Because hotspot probability is calculated from call volume, this pattern mechanically inflates predicted risk in already overpoliced, lower-income areas irrespective of the true underlying distribution of crime, the same representation-bias mechanism documented in the U.S. PredPol and Strategic Subject List literature, arising here through a structurally distinct but functionally analogous data pathway.[23]
3.3.4 Remote Sensing and Climate Variables Remain Marginal in the Indian Literature
Despite an active and growing international literature using remote-sensing indicators, vegetation indices, land surface temperature, and night-time lights to explain urban crime patterns (a systematic review of 36 qualifying English-language studies from 2003–2023 revealed that this approach was overwhelmingly concentrated in United States-based research), no India-specific study identified in this review incorporated satellite-derived environmental covariates into its crime model.[21] This is a significant omission given India's exposure to monsoon flooding, urban heat extremes, and pronounced seasonal population movement, each of which plausibly interacts with the routine-activity and crime-pattern mechanisms that the reviewed studies otherwise invoke.[5]
3.3.5 A Sustained Single-City Programme Demonstrates Thematic Breadth at the Cost of Methodological Consistency
The Tiruchirappalli, Tamil Nadu programme (represented by Mary Santhi et al., 2018, Mary Santhi et al., 2019, Mary Santhi et al., 2020; Section 2.3.1) is, on the basis of the evidence identified in this review, the only India-specific research effort to systematically link crime geography with offender socioeconomic profiling and temporal/seasonal variation within a sustained single-city programme.[12-14] Its thematic breadth complements the more common city-level emphasis on hotspot mapping and spatial association reported for Ajmer, Jodhpur, and Pune.[5,8,9] The Tiruchirappalli programme includes descriptive analyses of crime against women, offender socioeconomic characteristics, temporal and seasonal variation, criminal residence, and police-range patterns. Because the publications substantially share an underlying police record dataset, they are treated as one evidence unit rather than as independent replications. The program also relies primarily on descriptive percentage and concentration score analyses; the reviewed reports do not provide the formal spatial significance testing used in studies applying Moran's I or Getis-Ord Gi*. The evidence therefore adds thematic breadth but should not be interpreted as independent statistical replication of hotspot clustering.
3.4 Table of Study Characteristics
Table 2 presents thirteen methodologically representative studies from the full corpus of 29, selected to illustrate the range of datasets, features, temporal modeling, methods, explainability, applications, findings, and limitations.
4.1 Interpretation of Key Results
Taken together, the findings in Section 3 support three interpretive claims. First, the spatial concentration of crime in Indian cities is now an empirically well-established, cross-replicated finding (Section 3.3.1); this is established knowledge, not emerging evidence, and it directly answers the descriptive half of RQ1: Indian research has firmly demonstrated that GIS-based hotspot mapping identifies real, statistically significant, and policy-relevant spatial structure in Indian crime data. Second, the transition toward predictive machine learning (Section 3.3.2) is genuinely emerging evidence: the reported 93.20% accuracy figure comes from a 2024 study and represents one of the small number of published Indian applications identified in this review; it has not yet been independently replicated on an Indian dataset by a research group other than the one that produced the original model. This distinction between what is established and what is merely promising answers RQ1's second half directly: the field is transitioning, but the transition is earlier-stage than the raw publication-count trend in Fig. 5 might suggest. Third, and most consequential for RQ2, the evidence on operational deployment (Section 3.3.3) indicates that India's most prominent real-world system shares the same underlying bias mechanism documented in U.S. systems, despite following a structurally different technical architecture (place-based hotspot mapping rather than individual risk scoring). This is important for any assumption that India's avoidance of person-level scoring (unlike Chicago's Strategic Subject List) makes its systems inherently fairer: bias can enter through the input data pipeline as readily as through the scoring algorithm itself.
4.2 Comparison Across Studies, Scales, and Geographic Contexts
The scale-based framework introduced in Fig. 1 clarifies why direct comparison across the reviewed studies is difficult and why that difficulty is informative rather than merely a limitation of this review. At the local and district scale, Indian studies (Pune, Ajmer, Jodhpur, Thiruvananthapuram) converge methodologically – nearly all use KDE and/or Getis-Ord Gi* on police-station-level data – but diverge in reported outcome metrics, spatial unit size, and study period, making direct cross-city comparisons of hotspot intensity effectively impossible without access to raw, harmonized data. At the state scale, West Bengal and Haryana studies demonstrate that state crime records bureaux can support GIS analysis, but neither study benchmarks its findings against the national NCRB data series, leaving state-to-state comparisons reliant on inconsistent, nonstandardized secondary reporting. At the national scale, Delhi's CMAPS is the only deeply studied operational system, meaning that RQ2 can currently be answered only with reference to a single case, a serious constraint given India's federal police structure, in which each state operates as an independent force with distinct data practices. At the international scale, comparison is possible only at the level of documented failure modes rather than technical benchmarking because no Indian study reports the confusion-matrix-level detail needed to compute metrics comparable to the PredPol and Strategic Subject List evaluation literature.[23] This can be compared, and what this review considers one of its more original contributions is the mechanism of bias: U.S. systems have been shown to encode bias primarily through historically uneven arrest and patrol records feeding directly into the training data (a feedback loop mechanism), whereas CMAPS encodes a related but mechanistically distinct bias through differential emergency-call behavior across income strata (a reporting behavior mechanism). Both produce the same downstream harm, disproportionate predicted risk in already marginalized areas, but would require different technical remedies – a distinction the literature, taken piecemeal, does not draw out.
4.3 Strengths and Limitations of the Existing Evidence
The principal strength of the reviewed evidence is methodological consistency at the descriptive level: the repeated, cross-city replication of statistically significant spatial clustering (Section 3.3.1) using well-established, peer-reviewed statistical tests (Moran's I, Getis-Ord Gi*) constitutes genuinely robust evidence, meeting a reasonable standard of scientific reliability. Three limitations, however, substantially qualify what can be concluded about the newer, predictive strand of the literature. First, the metric heterogeneity discussed in Section 2.5 indicates that the field currently lacks any agreed upon common outcome measure, which is why this review reports a narrative rather than a pooled statistical synthesis; the juxtaposition of accuracy and spatial agreement values in Fig. 3 should be read as illustrating this heterogeneity, not as evidence that hybrid machine-learning models genuinely outperform GIS-based hotspot methods by five percentage points. Second, with respect to validation opacity, none of the six machine-learning studies reported whether their held-out test data were drawn from a different time period, different cities, or different crime types than their training data – a critical gap because a model that performs well only on data statistically similar to its training set provides limited genuine forecasting value. Third, independent evaluation is almost entirely absent: with the sole exception of Marda and Narayan's (2020) academic audit of CMAPS, every other operational or near-operational system referenced across the reviewed literature (Punjab's COGNOS-based analytics, the proposed CCTNS 2.0 predictive layer) has been described only in vendor, police, or government communications, not in independently peer-reviewed evaluations.[4] This is a data gap of the first order; it means that the central empirical question – whether any deployed Indian predictive-policing system actually reduces crime and whether it does so equitably – currently cannot be answered from the published literature at all. A further limitation concerns this review's own evidentiary base rather than the primary literature: the review's reliance on Scopus, Web of Science, IEEE Xplore, ScienceDirect, SpringerLink, and Google Scholar, while broad, may underrepresent Hindi- and regional-language police and administrative reports, state-level technical white papers not indexed in international databases, and unpublished vendor documentation – limits the review flags rather than allows to pass unstated, which is consistent with this review's own quality-appraisal standard.
4.4 Critical Quality Appraisal of the Included Evidence
Table 3 presents the review team's structured appraisal of eight representative primary empirical studies against the five quality dimensions defined in Section 2.4 (the four global systematic reviews in Table 4 are appraised qualitatively in Section 3.2 rather than rated here, since the appraisal dimensions are designed for primary rather than secondary studies). The appraisal indicates a clear split: descriptive GIS studies score consistently well on design clarity and data transparency but are rarely designed with formal predictive validation in mind (since none claim to forecast future, as opposed to describing past crime); machine-learning studies score well on quantitative validation but poorly on replicability, since none of the reviewed papers published their code or model weights; the Tiruchirappalli program scores well on design clarity given its consistent descriptive approach across eighteen publications but is rated limited on validation rigour, since none of the publications examined report formal spatial-statistical significance testing, and limited on replicability given the heterogeneous, only partially indexed venues in which it appeared (Section 3.3.5); and the single operational case study is the only source in the entire corpus to score high on explicit bias and fairness consideration – underscoring how rarely this dimension is engaged with directly in the technical literature.[4]
Table 3: Dataset and evidence-provenance matrix
| Evidence/data source | Collection context | Records/instances | Parameters/features reported or used | Role and selection rationale | Accessibility/limitation |
|---|---|---|---|---|---|
| Review evidence corpus | Six-database search plus citation/snowball tracking, 2000–Aug 2026 | 233 identified; 186 unique after duplicate removal; 29 included | Study design, location/scale, data source, period, method, outcomes, limitations, validation, bias/fairness, replicability | Primary evidence base; selected using predefined eligibility criteria | Study-level evidence; underlying datasets remain with original custodians. |
| Tiruchirappalli police records | City police records, predominantly 2012–2017; 18 linked publications | Record count not reported in the review source | Crime type, police range, temporal/seasonal variables, offender socioeconomic attributes, residence | Consolidated as one evidence unit because publications substantially share an underlying dataset | No public downloadable dataset identified in the reviewed publications. |
| Delhi CMAPS inputs | Operational predictive-policing system; Delhi | Record count not reported | Dial-100 emergency calls, CCTNS FIRs, location/call-volume information, CMAPS outputs | Included to assess operational data provenance and representational bias | Operational/police data; independent access is restricted. |
| Pune police-station records | Pune, 2012–2015 | Record count not reported | Crime type, location, time; four crime types explicitly discussed | Used to compare KDE, Getis-Ord Gi*, and Space–Time Permutation Model | City-specific administrative records; raw data not reported as openly downloadable. |
| Indian Crime Dataset (2020–2024) | National dataset used in a recent ML study | Record count and exact version not reported | Crime-record attributes used for classification; complete feature list not reported | Represents transition from GIS hotspot description to ML prediction | Public repository/version not established from the reviewed source; performance claims are treated as reported, not independently reproduced. |
| NCRB Crime in India | National administrative crime statistics | Annual/state/city aggregates | Crime categories, state/UT/city, year, incidence and related administrative variables | Contextual provenance for national crime statistics; not newly analyzed as a primary dataset here | Public official reports; figures reflect data supplied by States/UTs and should not be interpreted as direct measures of true crime incidence. |
| Note: "Not reported" indicates information not supplied in the reviewed source and not inferred. |
Table 4: Transparent accounting of records identified, screened, excluded, and included in the review
| Selection stage | Records (n) | Records excluded | Reason/outcome |
|---|---|---|---|
| Primary database/search identification | 214 | — | Records retrieved from the six primary sources. |
| Supplementary citation/snowball identification | 19 | — | Additional records; n = 19 refers to records, not included studies. |
| Combined identification pool | 233 | — | 214 + 19 records before duplicate removal. |
| Duplicate removal | 186 | 47 | Duplicate records removed; 186 unique records proceeded to screening. |
| Title/abstract screening | 90 | 96 | Excluded as off-topic, nonempirical, or lacking India-specific/comparative relevance. |
| Full-text eligibility assessment | 29 | 61 | 44 excluded for insufficient spatial/GeoAI method or methodological reporting; 17 for duplicate/overlapping-dataset reporting. |
| Final synthesis | 29 | — | 18 India-specific evidence units (including one consolidated multireport programme) + 11 comparator/foundational/methodological sources. |
5. Implications and Future Directions
The appraisal indicates a clear split: descriptive GIS studies generally provide clear spatial designs but are not designed for formal predictive validation; machine-learning studies report quantitative validation but limited replicability because code or model weights are not available in the reviewed papers; the Tiruchirappalli programme has a consistent descriptive design but limited formal spatial-statistical validation; and the CMAPS auditor is the only evidence unit in the corpus to engage directly and substantially with bias and fairness. The appraisal is intended to make differences in evidentiary strength visible rather than to convert heterogeneous studies into a single numerical score. Three policy-relevant implications follow directly from the synthesis in Section 4, each linked to a specific finding rather than offered as generic advice. First, because the spatial concentration of crime is established knowledge (Section 4.1), Indian police departments below the small number currently piloting advanced analytics (Delhi, Punjab) can adopt low-cost, well-validated KDE and Getis-Ord Gi* hotspot mapping with considerable confidence in its descriptive reliability; this is a low-risk, evidence-backed first step that does not require ethical safeguards more urgently needed for predictive systems. Second, because the CMAPS case study demonstrates that place-based systems are not automatically immune to the representational bias documented in individual risk-scoring systems (Section 4.2), any Indian jurisdiction considering an operational predictive layer should commission an independent, published bias audit of its input data streams modeled on Marda and Narayan's (2020) methodology before, not after, deployment. Third, because independent evaluation of operational systems is almost entirely absent from the literature (Section 4.3), policy bodies such as the Bureau of Police Research and Development and the National Crime Records Bureau are well placed to mandate that any future CCTNS 2.0 predictive module be released with sufficient methodological transparency, potentially under a research-access exemption to relevant data-protection provisions, to permit the independent academic evaluation that Section 4.3 shows is currently structurally impossible.[16,17]
5.2 Research Gaps and Priorities
Rather than close with a generic call for further study, this review identifies six research priorities, each addressing a distinct gap substantiated in Sections 3 and 4 and visualized in Fig. 6.
Priority 1: Data infrastructure. The absence of harmonized, geocoded, FIR-level data linked consistently across CCTNS, the NCRB, and the individual State Crime Records Bureaux (Section 4.2) is the single most binding constraint on every other priority listed here; without it, neither cross-state benchmarking (Priority 5) nor independent evaluation (Priority 6) is achievable.
Priority 2: Bias auditing. Given that the only available operational case study documents clear representational bias (Section 3.3.3), independent, published, pre- and postdeployment bias audits should be treated as a precondition for any continued operation of the predictive-policing system, not an optional research add-on.
Priority 3: Place-based modeling. Risk terrain modeling and hotspot-based approaches provide place-level outputs that are relatively auditable and align with the emphasis of the review on transparent, location-based analysis. Future Indian systems can therefore test place-based architectures alongside, rather than automatically replacing them with, individual-level risk scoring, with explicit evaluation of accuracy, fairness, and legal safeguards.
Priority 4: Climate–crime linkage. Despite India's flood and heat exposure, the near-total absence of remote-sensing and climate covariates in the Indian literature (Section 3.3.4) represents the clearest thematic gap identified in this review and a natural convergence point for collaboration among geoscience, climate science, and criminology researchers.
Priority 5: Cross-state benchmarking. A common, harmonized outcome-reporting standard addressing the metric heterogeneity problem identified in Section 2.6 would allow the many isolated single-city Indian studies identified in this review to be meaningfully compared.
Priority 6: Independent evaluation. Sustained academic access to evaluate deployed systems' real-world accuracy and equity, rather than reliance on vendor or police self-reports, is the precondition for answering RQ2 with any operational system beyond the CMAPS.
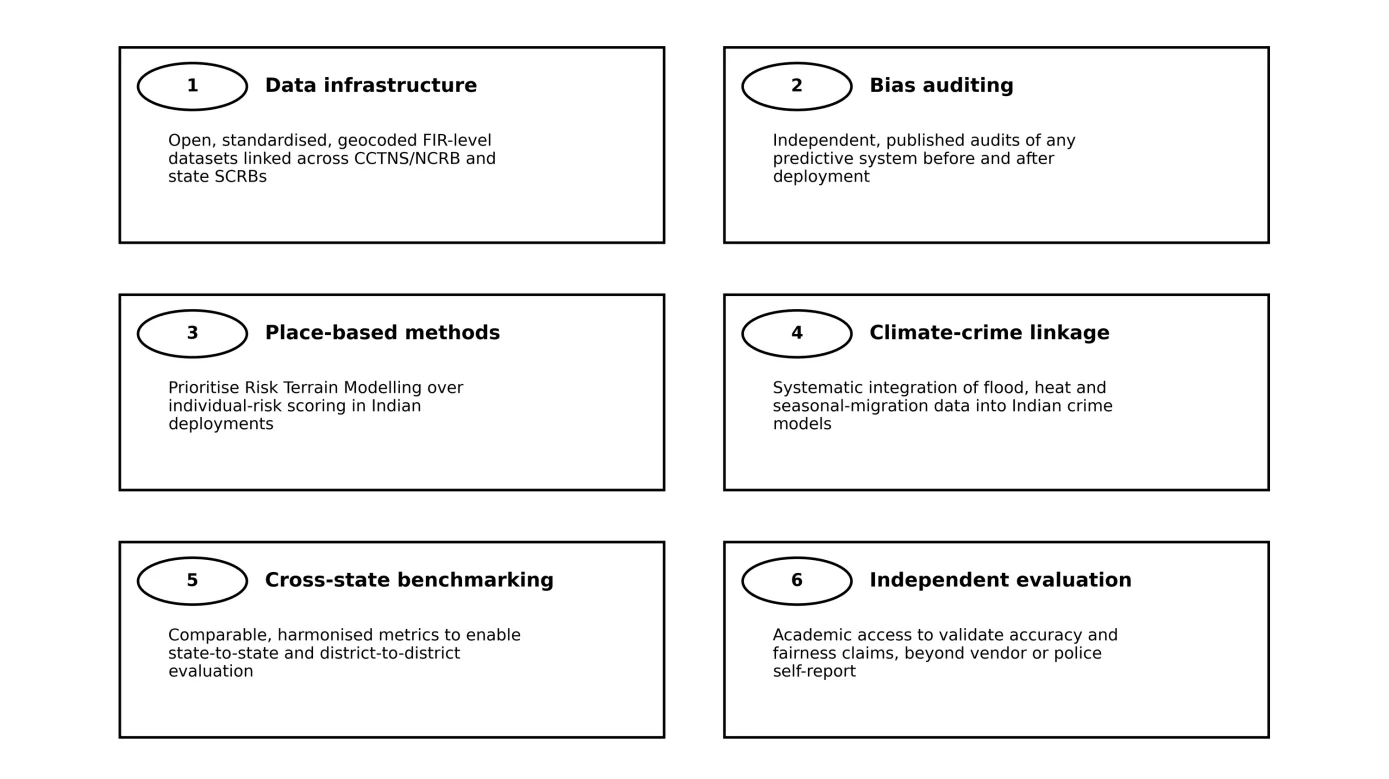
Fig. 6: Roadmap of proposed research priority synthesized from the gaps identified in this review.
5.3 Distinguishing Established Knowledge, Emerging Evidence, and Speculation
In the interest of epistemic clarity, this review closes this section by classifying the review's central claims into three tiers. Established knowledge: crime clusters significantly and nonrandomly across Indian urban space, replicated across at least six independent city-level studies using multiple statistical tests. Emerging evidence: Machine-learning and deep-learning methods can achieve high classification accuracy on historical Indian crime datasets, although this evidence currently rests on a small number of studies without independent replication or robust temporal/spatial cross-validation. Research speculation, clearly labeled as such: whether integrating remote-sensing climate covariates would materially improve Indian crime-prediction accuracy is, at present, a plausible but untested hypothesis, no included study has tested it, and it is offered here as a priority for future research (Priority 4), not as a conclusion this review's evidence supports.
6. Conclusion
Overall, the review demonstrates that the Indian crime-geography literature has a stronger descriptive than predictive evidence base. Across the included studies that test for spatial clustering, crime is repeatedly reported as being geographically concentrated, supporting the continued use of transparent GIS-based hotspot analysis for descriptive and exploratory purposes. In contrast, recent machine-learning studies report high classification accuracy on historical datasets but provide limited evidence for independent replication, cross-city transfer, temporal generalization, or operational crime reduction. Therefore, the synthesis distinguishes the reported model performance from the demonstrated real-world predictive effectiveness. This review also contributes to a clearer account of how data provenance can shape predictive outputs. The Delhi CMAPS case indicates that place-based predictive risk can be affected by differential reporting behavior in emergency-call and FIR data. These findings reinforce the need to evaluate the data generation process, not only the algorithm. The evidence matrix and quality appraisal further reveal that dataset provenance, validation design, explainability, and reproducibility are inconsistently reported across the literature. The six priorities identified in Section 5.2 – harmonized data infrastructure, independent bias auditing, place-based modeling, climate-crime integration, cross-state benchmarking, and independent evaluation – follow directly from these evidence gaps.
Acknowledgements
Not applicable.
CRediT Author Contribution Statement
S. Balaselvakumar: Conceptualization, Data curation, Formal analysis, Investigation, Methodology, Project administration, Supervision, Visualization, Writing – Original Draft, Writing – Review & Editing. P. Mary Santhi: Conceptualization, Data curation, Formal analysis, Investigation, Methodology, Validation, Writing – Review & Editing. All authors have read and approved the final version of the manuscript for publication and agree to be accountable for all aspects of the work, ensuring that questions related to the accuracy or integrity of any part of the work are appropriately investigated and resolved.
Funding Declaration
This research did not receive any specific grant from funding agencies in the public, commercial, or not-for-profit sectors. No external funder had a role in the design of the review, literature searching, data extraction, analysis, interpretation, manuscript preparation, or the decision to submit the article for publication.
Data Availability Statement
No new primary crime dataset was generated or collected for this systematic review. The bibliographic records and study-level extraction information underlying the synthesis are derived from the publications identified through the search and are documented in the study-selection table, evidence/data-provenance matrix, literature-review table, quality appraisal, and reference list. Underlying police, CCTNS, FIR, Dial-100, and other administrative datasets remain with their original custodians and are not publicly redistributed by the authors. Public NCRB statistical material is available through the official NCRB website (https://www.ncrb.gov.in/) and the Government of India OGD Platform (https://www.data.gov.in/). For the 2020–2024 Indian Crime Dataset reported in the reviewed literature, the source examined in this review did not provide sufficient repository or version metadata to establish a stable public download. No new code or computational dataset was generated by the authors.
Conflict of Interest
There is no conflict of interest.
Artificial Intelligence (AI) Use Disclosure
The authors declare that artificial intelligence (AI)-assisted tools were used only for language refinement, grammar improvement, and manuscript structuring purposes during the preparation of this work. All technical content, experimental implementation, results, and interpretations were independently developed and verified by the authors.
Supporting Information
Not applicable.
References
- [1] L. E. Cohen, M. Felson, Social change and crime rate trends: A routine activity approach, American Sociological Review, 1979, 44, 588–608, doi: 10.2307/2094589.
- [2] S. Chainey, L. Tompson, S. Uhlig, The utility of hotspot mapping for predicting spatial patterns of crime, Security Journal, 2008, 21, 4–28, doi: 10.1057/palgrave.sj.8350066.
- [3] K. Janowicz, S. Gao, G. McKenzie, Y. Hu, B. Bhaduri, GeoAI: Spatially explicit artificial intelligence techniques for geographic knowledge discovery and beyond, International Journal of Geographical Information Science, 2020, 34, 625–636, doi: 10.1080/13658816.2019.1684500.
- [4] V. Marda, S. Narayan, Data in New Delhi's predictive policing system, Proceedings of the 2020 Conference on Fairness, Accountability, and Transparency, ACM, 2020, 317–324, doi: 10.1145/3351095.3372865.
- [5] S. Mondal, D. Singh, R. Kumar, Crime hotspot detection using statistical and geospatial methods: A case study of Pune City, Maharashtra, India, GeoJournal, 2022, 87, 5287–5303, doi: 10.1007/s10708-022-10573-z.
- [6] P. Biswas, N. Das Chatterjee, Tears behind the closed doors: A logistic analysis of domestic violence against women in West Bengal, India, Crime & Delinquency, 2025, 71, 2733–2757, doi: 10.1177/00111287231202784.
- [7] P. Biswas, N. Das Chatterjee, Predicting future crime hotspots using statistical techniques and GIS. In Crime prediction using GIS and statistical modelling: A study on crime against women in West Bengal, Springer, 2025, 65–80, doi: 10.1007/978-3-031-81448-8_4.
- [8] M. Kannan, Geographical information system and crime mapping—a study of Ajmer City, Rajasthan, The Indian Geographical Journal, 2017, 92, 29–39.
- [9] S. Lama, S. S. Rathore, Crime mapping and crime analysis of property crimes in Jodhpur, International Annals of Criminology, 2017, 55, 205–219, doi: 10.1017/cri.2017.11.
- [10] K. Sukhija, S. N. Singh, J. Kumar, Spatial visualization approach for detecting criminal hotspots: An analysis of total cognizable crimes in the state of Haryana, 2017 2nd IEEE International Conference on Recent Trends in Electronics, Information & Communication Technology (RTEICT), IEEE, 2017, 1060–1066, doi: 10.1109/RTEICT.2017.8256761.
- [11] A. Meijer, M. Wessels, Predictive policing: Review of benefits and drawbacks, International Journal of Public Administration, 2019, 42, 1031–1039, doi: 10.1080/01900692.2019.1575664.
- [12] P. M. Santhi, S. Balaselvakumar, K. Kumaraswamy, Geostatistics and geoinformatics in the analysis of 'crime against women' in Tiruchirappalli city, Tamil Nadu, Geo-Eye, 2018, 7, 32–37, doi: 10.53989/bu.ge.v7i2.8.
- [13] P. M. Santhi, S. Balaselvakumar, K. Kumaraswamy, A study on socio-economic aspects of criminals in Tiruchirappalli City, Tamil Nadu, Geographical Analysis, 2019, 8, 17–23, doi: 10.53989/bu.ga.v8i1.4.
- [14] P. M. Santhi, S. Balaselvakumar, K. Kumaraswamy, Geoinformatics for temporal and seasonal variation of crime occurrences in Tiruchirappalli City, Tamil Nadu, The International Journal of Analytical and Experimental Modal Analysis, 2020, 12, 1310–1326.
- [15] B. P. A. Prabhu, T. Sharma, N. L. Taranath, K. Dilip, Forecasting criminal activity: An empirical approach for crime rate prediction, Proceedings of International Conference on Recent Innovations in Computing (ICRIC 2023), Springer, 2024, 1194, 225–235, doi: 10.1007/978-981-97-2839-8_16.
- [16] National Crime Records Bureau, Crime in India 2023, Ministry of Home Affairs, Government of India, 2023. Available at: https://www.ncrb.gov.in/, Accessed 25 July 2026.
- [17] National Crime Records Bureau, Crime in India 2024, Ministry of Home Affairs, Government of India, 2024. Available at: https://www.ncrb.gov.in/, Accessed 24 July 2026.
- [18] V. Mandalapu, L. Elluri, P. Vyas, N. Roy, Crime prediction using machine learning and deep learning: A systematic review and future directions, IEEE Access, 2023, 11, 60153–60170, doi: 10.1109/ACCESS.2023.3286344.
- [19] O. Mansourihanis, M. J. Maghsoodi Tilaki, R. Armitage, A. Zaroujtaghi, Evolution and prospects of Geographic Information Systems (GIS) applications in urban crime analysis: A review of literature, Remote Sensing Applications: Society and Environment, 2025, 38, 101583, doi: 10.1016/j.rsase.2025.101583.
- [20] O. Kounadi, A. Ristea, A. Araujo, M. Leitner, A systematic review on spatial crime forecasting, Crime Science, 2020, 9, 7, doi: 10.1186/s40163-020-00116-7.
- [21] V. Ceccato, I. Ioannidis, Using remote sensing data in urban crime analysis: A systematic review of English-language literature from 2003 to 2023, International Criminal Justice Review, 2025, 35, 102–122, doi: 10.1177/10575677241237960.
- [22] N. Iqbal, A. Hassan, T. Waheed, AI-driven crime prediction: A systematic literature review, Journal of Computational Social Science, 2025, 8, 53, doi: 10.1007/s42001-025-00373-z.
- [23] A. L. DaViera, M. Uriostegui, A. Gottlieb, O. (C.) Onyeka, Risk, race, and predictive policing: A critical race theory analysis of the strategic subject list, American Journal of Community Psychology, 2024, 73, 91–103, doi: 10.1002/ajcp.12671.
Publisher Note
The views, statements, and data in all publications solely belong to the authors and contributors. GR Scholastic is not responsible for any injury resulting from the ideas, methods, or products mentioned. GR Scholastic remains neutral regarding jurisdictional claims in published maps and institutional affiliations.
Open Access
This article is licensed under a Creative Commons Attribution-NonCommercial 4.0 International License, which permits the non-commercial use, sharing, adaptation, distribution and reproduction in any medium or format, as long as appropriate credit to the original author(s) and the source is given by providing a link to the Creative Commons License and changes need to be indicated if there are any. The images or other third-party material in this article are included in the article's Creative Commons License, unless indicated otherwise in a credit line to the material. If material is not included in the article's Creative Commons License and your intended use is not permitted by statutory regulation or exceeds the permitted use, you will need to obtain permission directly from the copyright holder. To view a copy of this License, visit: https://creativecommons.org/licenses/by-nc/4.0/
© The Author(s) 2026