

 Open Access||Research Article
Enhanced surface plasmon resonance sensor employing blue phosphorus and franckeite for urine glucose detection
Rajeev Kumar1 , Lalit Garia2, Biswajit Brahma3, Akash Kumar Bhoi4
1 Department of Electronics and Communication Engineering, Graphic Era (Deemed to be University), Dehradun, Uttarakhand, 248001, India
2 Department of Electronics and Communication Engineering, Bipin Tripathi Kumaon Institute of Technology, Dwarahat, Uttarakhand, 263653, India
3 McKesson Corporation, 32559 Lake Bridgeport St, Fremont, CA 94555, USA
4 Department of Electronics and Telecommunication Engineering, Symbiosis Institute of Technology, Pune Campus, Symbiosis International (Deemed University), Pune, Maharashtra, 412115, India
Abstract
A multilayer surface plasmon resonance (SPR) sensor for glucose detection in urine samples based on the CaF2 prism/Cu/SiO2/Blue Phosphorus (BlueP)/Franckeite/Glucose configuration is presented in this work. The suggested design enhances the interaction of the evanescent field with the glucose-containing sensing medium (SM) by combining a Cu plasmonic layer with SiO2, BP, and Franckeite layers. To achieve a strong SPR response and better sensing properties, the Cu and SiO2 layer thicknesses are optimized. The sensor exhibits a maximum angular sensitivity of 385.55°/RIU at the optimized structure with a remarkable Rmin value. For various layer thickness combinations, the corresponding minimum reflectance (Rmin), full width at half maximum (FWHM), detection accuracy (DA), and figure of merit (FoM) are methodically assessed. To detect glucose, the analyte's refractive index (RI) is changed over the range under consideration, and the resulting resonance-angle shift is examined. The optimized sensor shows a sensitivity of 381.11°/RIU at an analyte RI of 1.347, with Rmin = 0.11866, FWHM = 4.63°, DA = 0.215/°, and FoM = 82.31/RIU. Additionally, the PD is obtained of 208.16 (at RI = 1.335) and 210.16 (at RI = 1.347). The findings show that the suggested multilayer architecture offers a viable platform for sensitive, label-free, and real-time urine glucose concentration monitoring. Experimental fabrication and validation using manufactured sensor prototypes and actual urine samples have not been carried out because the current study is limited to numerical analysis. In order to verify the anticipated sensing performance and evaluate the usefulness of the suggested sensor, experimental research will be taken into consideration in subsequent work.
Keywords
Graphical Abstract
Novelty Statement
This work introduces a novel multilayer surface plasmon resonance (SPR) sensor utilizing a unique CaF2 prism/Cu/SiO2/Blue Phosphorus (BlueP)/Franckeite configuration specifically optimized for label-free urine glucose detection. By strategically combining a copper plasmonic layer with emerging 2D materials (Blue Phosphorus and Franckeite), the proposed architecture drastically enhances evanescent field interaction to achieve an unprecedented maximum angular sensitivity of 385.55°/RIU.
1. Introduction
Glucose is a basic biomolecule that plays an essential role in maintaining the energy balance of the body and is mainly regulated by insulin. Diabetes mellitus, which is primarily classified as Type I and Type II diabetes, can be caused by abnormal glucose regulation. If the condition is not identified and treated in its early stages, it can lead to serious complications like kidney failure, cardiovascular problems, liver dysfunction, blindness, and other organ damage.[1–3] The importance of precise, quick, and frequent glucose monitoring is highlighted by the rising incidence of diabetes globally. The development of non-invasive sensing techniques was prompted by the invasiveness of conventional finger-prick techniques, which can result in pain, discomfort, and even infection.[4] Urine is a particularly appealing alternative sampling medium because it is simple and painless to collect and may offer valuable insights into glucose metabolism. However, there are a number of drawbacks to traditional colorimetric and electrochemical techniques, including interference from other metabolites, temperature and pH dependence, frequent calibration requirements, electrode instability, and limited long-term reliability.[5] For accurate glucose monitoring, it is therefore very desirable to develop a sensitive, label-free, and non-invasive sensing platform. SPR sensors present a viable solution in this regard since variations in the SPR response can be used to track changes in the RI of the SM.[6]
At the interface between a metal and a dielectric medium, incident polarized light interacts with free electrons to cause SPR, an optical sensing phenomenon. Light is coupled through a high-RI prism onto a thin metallic layer, usually made of gold (Au), silver (Ag), or copper (Cu), at the proper incident angle in a conventional Kretschmann configuration.[7] There is a noticeable drop in reflected intensity when the momentum of the incident photons and the surface plasmon polaritons match at a certain resonance condition. SPR is a promising method for the real-time, label-free detection of a variety of chemical and biological analytes because the resonance condition is extremely sensitive to changes in the RI of the SM. The optical properties and thickness of the metallic layer, along with the characteristics of the nearby dielectric or sensing layers, have a significant impact on the sensing performance of an SPR sensor.[8] The RI close to the metal surface is changed by variations in the analyte concentration, which results in a discernible change in the resonance angle or wavelength. Because of their high sensitivity, quick response time, small size, and potential for use in chemical, environmental, and biomedical sensing, SPR sensors have garnered a lot of interest.
Applying appropriate dielectric and two-dimensional (2D) material layers over the plasmonic metal can greatly enhance the performance of an SPR sensor because these layers have a significant impact on analyte interaction, electromagnetic-field confinement, SPP propagation, and overall resonance properties.[9–11] Because of its chemical stability, appropriate RI, optical transparency, and compatibility with multilayer SPR configurations, silicon dioxide (SiO2) is widely regarded as a helpful intermediate or protective layer among various dielectric materials. The SiO2 layer's thickness and presence can change the metal–dielectric interface's effective optical environment, which in turn can change the resonance angle, resonance wavelength, Rmin, and resonance linewidth. Effective coupling of the evanescent field with the analyte can be maintained while a controlled separation between the metallic layer and the functional sensing layers is provided by an appropriately optimized SiO2 layer.[12] An appealing method for improving the interaction of the SPR-generated electromagnetic field with the sensing medium, in addition to SiO2, is the integration of 2D materials like Blue Phosphorus (BlueP).[13,14] BlueP's layered structure, large exposed surface area, and thickness-dependent optical and electronic properties can boost the interaction between the evanescent field and target molecules and offer more active sites for analyte adsorption.[15] The presence of an appropriately optimized BlueP layer can increase the effective sensing region and alter the local RI environment, which can lead to an observable shift in the SPR response because a significant portion of the SPR field is confined near the metal surface. Additionally, another material that shows promise for building high-performance plasmonic sensing platforms is Franckeite, a naturally occurring layered van der Waals material made of alternating sublayers.[16] Its layered design and anisotropic optical properties can offer more control over the distribution of electromagnetic fields and light-matter interaction within the multilayer structure. Therefore, the combination of Franckeite and BlueP can produce a synergistic functional interface where each 2D material's unique optical and surface properties enhance analyte interaction and improve SPR response modulation.
The investigation of alternative two-dimensional (2D) materials is still crucial for increasing the flexibility of plasmonic sensor design, even though graphene and MoS2 have been thoroughly studied for SPR sensing due to their advantageous optical and electronic properties. BlueP is a promising surface-modifying material for improving the interaction between the evanescent field and the sensing medium because of its distinct layered structure and advantageous optical response. Franckeite, a naturally occurring layered van der Waals material, offers complementary optical properties that can further alter the multilayer structure's electromagnetic response. In order to take advantage of their complementary contributions to light-matter interaction, BlueP and Franckeite are combined in this work instead of depending solely on one traditional 2D material. In order to achieve improved resonance-angle sensitivity and good sensing performance, the suggested Cu/SiO2/BlueP/Franckeite configuration thus offers an alternative material platform to frequently studied graphene- and MoS2-based SPR sensors. The sensitivity, FWHM, DA, and FoM derived from the numerical analysis are used to further assess the choice quantitatively.
Moreover, the combined SiO2/BlueP/Franckeite arrangement can offer greater flexibility in optimizing the electric-field distribution across the metal–dielectric–analyte region and in engineering the effective refractive-index profile of the sensing structure. Because overly thick functional layers can decrease the effective interaction of the evanescent field with the analyte and broaden or weaken the resonance, while properly chosen thicknesses can improve field confinement and preserve a sharp resonance profile, the thickness, order, and optical properties of these layers must be carefully optimized. As a result, adding SiO2, BlueP, and Franckeite as complementary dielectric and 2D functional layers is a viable method for modifying the optical response of SPR sensors and obtaining better resonance characteristics, increased refractive-index sensitivity, and improved overall sensing performance for chemical and biological detection applications. In order to improve the interaction of the evanescent field with the glucose-containing SM and enable sensitive detection over the RI range of 1.33–1.347, the suggested structure makes use of the synergistic optical properties of the constituent layers.
2. Proposed structure, refractive index, modeling and performance parameters
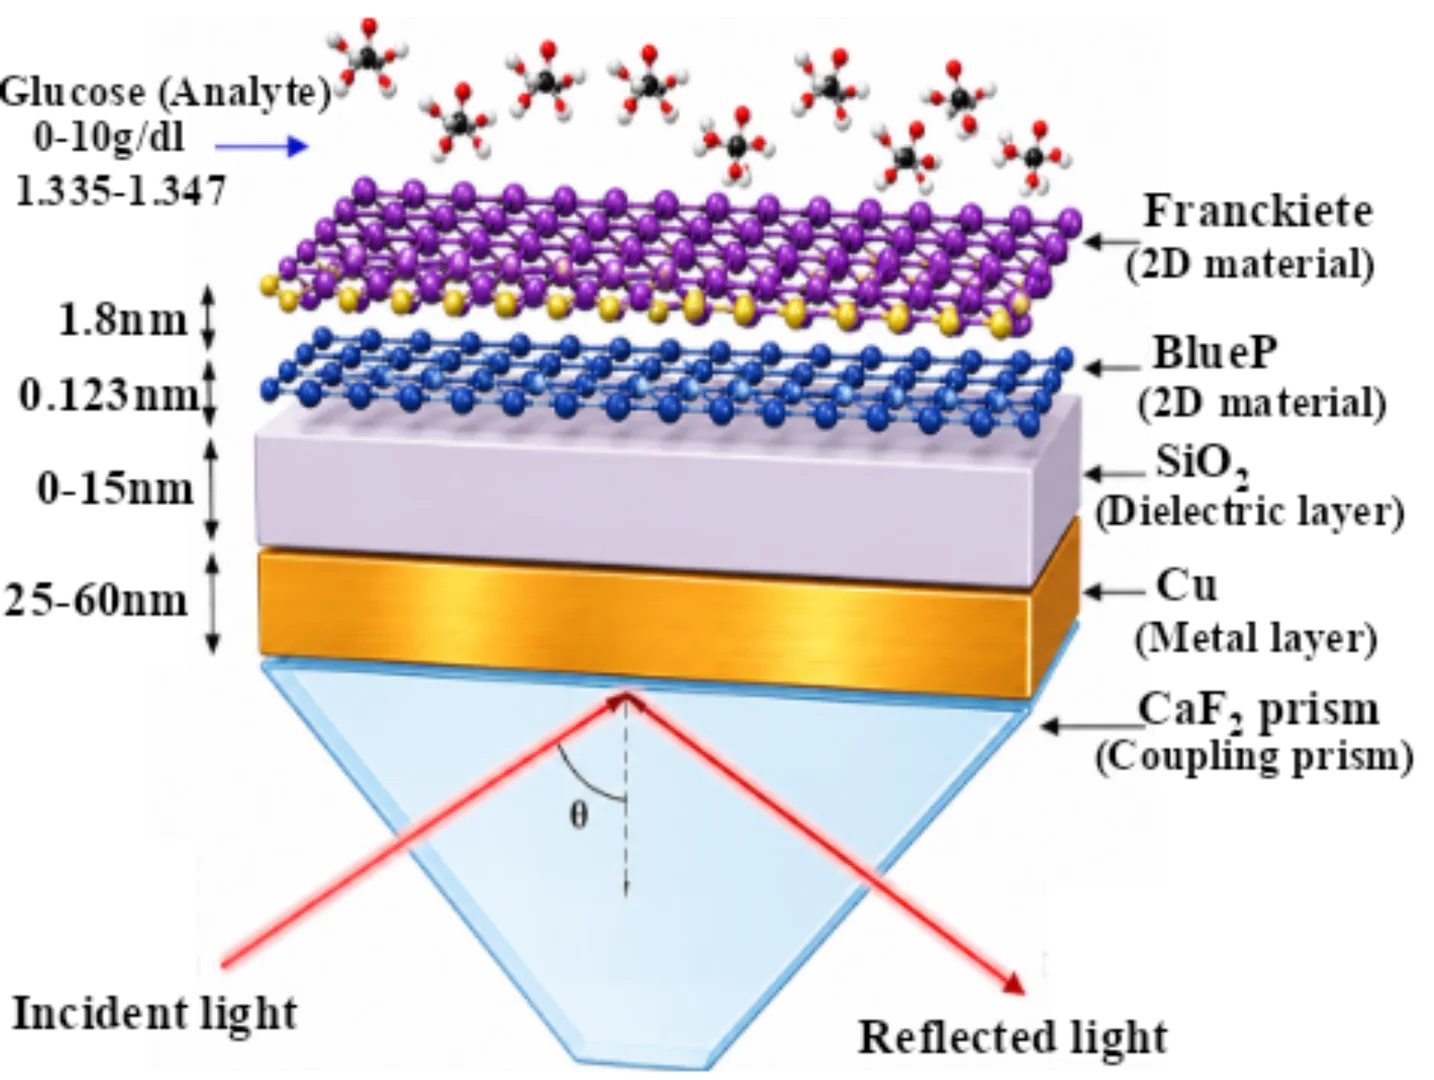
In the Kretschmann configuration, the optical coupling medium is the CaF2 prism. At the CaF2/Cu interface, incident p-polarized light is internally reflected after entering the CaF2 prism as shown in Fig. 1. CaF2 is chosen because the surface plasmon mode supported by the metal layer and the incident light have appropriate momentum matching thanks to its refractive index. The in-plane component of the incident wavevector can be adjusted until the SPR condition is met by changing the incident angle θ.
The principal plasmonic metal layer is the Cu layer. Energy is transferred from the incident optical wave to collective oscillations of free electrons in Cu when the momentum of the incident p-polarized light matches the surface plasmon wavevector at the metal/dielectric interface. The SPR resonance dip, a noticeable minimum in the reflected intensity, is the result of this. Thus, a crucial optimization parameter is the Cu thickness. Strong plasmon excitation and a sharp resonance can be achieved in the studied structure by optimizing a Cu thickness in the roughly 30–50 nm range.
The SiO2 layer is positioned as a dielectric spacer between Cu and BlueP. It adjusts the metal interface's effective optical environment and regulates the evanescent electric field's penetration and distribution in the direction of the sensing area. The linewidth, sensitivity, minimum reflectance, and resonance angle are all significantly impacted by its thickness. The best combination with the Cu thickness can be found by investigating SiO2 thicknesses of roughly 5–15 nm based on the optimization previously demonstrated. An appropriately chosen SiO2 thickness can enhance the plasmonic field's coupling with the two-dimensional materials on top.
Above SiO2 is a 2D, atomically thin layer called BlueP (blue phosphorus). BlueP increases the interaction of the evanescent plasmonic field with the analyte and alters the optical response of the multilayer structure due to its large interfacial surface area and strong light–matter interaction. The electromagnetic field produced at the Cu/SiO2 interface can interact with the 2D-material region and eventually the glucose layer because of its location directly below Franckeite.
Another 2D substance that was deposited above BlueP is the Franckeite layer. It also changes the sensing interface's optical dispersion and effective RI. Cu/SiO2/BlueP/Franckeite produces a multilayer electromagnetic environment where the analyte can be reached by the evanescent field. When compared to a basic Cu-based SPR structure, the presence of these 2D layers can increase the refractive-index sensitivity because the sensing response is highly dependent on the electric-field interaction near the analyte interface.
The sensing/analyte medium is the glucose layer that is at the top. The corresponding RI values in the numerical model are used to represent the glucose concentration. About ns = 1.335 for the lower concentration condition and ns = 1.347 for the higher concentration condition, which correspond to the examined glucose range, are the two conditions taken into consideration. Its effective RI varies in response to changes in glucose concentration. The Franckeite layer's dielectric environment is altered as a result, which alters the surface-plasmon resonance condition.
2.2 Refractive index of constituent layers
The RI of each layer has a major impact on the recommended SPR excitation condition and sensing performance. The ability of a material to interact with incident electromagnetic waves and slow their propagation is represented by the RI. An SPR sensor reaches resonance when the wave vectors of the incident p-polarized light and the SP wave vector at the metal–dielectric interface coincide. The SPR resonance angle shifts as a result of the momentum matching condition being altered by any change in the analyte medium's RI. CaF2 is used as the coupling prism in the proposed structure, providing efficient light coupling for plasmon excitation, with an RI of 1.4329 at a wavelength of 633 nm. The plasmonics layer of Cu (thickness = 25 to 60 nm) is usually described using RIs of 0.0369 + 4.5393i because of its metallic nature and optical losses. The third layer is used as a SiO2 layer (thickness 0–15 nm) and has an RI of 1.4570. The BlueP layer has a complex RI of 2.1666 + 0.1005i with a thickness of 0.123 nm due to strong light-matter interaction, which improves electromagnetic field confinement at the sensing interface.[14] The next Franckeite layer is used as a biorecognition element layer for the detection of glucose in a urine sample. The RI of glucose with concentration is given in Table 1. The RI of urine varies with the concentration of dissolved substances, particularly glucose, making it a suitable parameter for SPR-based glucose sensing. Because there are more glucose molecules in the sensing medium when the glucose concentration rises, the RI of the urine sample typically rises as well. Therefore, corresponding RI values within the chosen physiological range can be used to represent different glucose concentrations for SPR analysis. The resonance condition is altered by the RI variation, which also results in a discernible shift in the SPR curve. Thus, it is possible to identify and measure the amount of glucose in urine samples by keeping an eye on the resonance-angle or resonance-wavelength shift. Using SPR sensors, this RI-based method offers a straightforward, label-free way to detect glucose.
| Urine glucose concentration | Refractive index |
|---|---|
| 0–15 mg/dl (normal range) | 1.335 |
| 0.625 g/dl | 1.336 |
| 1.25 g/dl | 1.337 |
| 2.5 g/dl | 1.338 |
| 5 g/dl | 1.341 |
| 10 g/dl | 1.347 |
2.3 Mathematical modeling used in SPR sensor
The optical response of the suggested SPR structure is examined using the transfer matrix method (TMM) under the Kretschmann configuration. Surface plasmon polaritons (SPPs) at the metal–dielectric interface is excited in this configuration by coupling p-polarized incident light through the CaF2 prism. The thicknesses, refractive indices, and dielectric characteristics of each layer have a significant impact on the occurrence of SPR. The TMM makes it possible to calculate the multilayer structure's overall optical response by relating the tangential components of the electric and magnetic fields across each interface. The reflection coefficient and associated reflectivity are obtained by multiplying the characteristic matrices of all constituent layers using the Fresnel equations. The expression for reflectivity (R) is as follows (Eq. 1).[18]
R = |rp|² (1)
Where,
rp = [(m11 + m12·qN)·q1 − (m21 + m22·qN)] / [(m11 + m12·qN)·q1 + (m21 + m22·qN)] (2)
where rp represents the reflection coefficient. The TMM used to simulate light propagation and determine the reflectivity of a multilayer SPR structure, as indicated by Eq. 2, is described by the provided formulas. For p-polarized light, the reflection coefficient is rp. The optical response of every intermediate layer between the prism and SM is represented by the characteristic matrix elements m11, m12, m21, and m22, respectively.
Where βk is defined as in Eq. 3:
βk = (2π/λ)·nk·dk·cos θk, qk = nk·cos θk (3)
The characteristic matrix (mk) of the SPR structure is obtained by multiplying the TMM of each intermediate layer. The symbols m11, m12, m21, and m22 stand for the components of the overall transfer matrix. The characteristic matrices of each layer in an N-layer SPR configuration are multiplied to form the total matrix. Eq. 4 illustrates how each layer's phase constant (βk) and optical admittance (qk) are determined by its RI, thickness, wavelength, and incident angle. This matrix formulation enables the calculation of the reflectivity and reflection coefficient of the proposed sensor by taking into account the contributions of each layer.
Mk = cos βk −i sin βk/qk−i qk sin βk cos βk (4)
[M] = M1 × M2 × ⋯ × MN−1 (5)
2.4 Performance parameters of the proposed sensor
The performance of the proposed SPR sensor is evaluated using a number of important metrics, including sensitivity (S), FWHM, DA, and FoM. These parameters determine the sensor's ability to detect minute changes in the RI caused by different cancer cells. Changes in the cancerous cell RI are what cause the shift in resonance angle.
Sensitivity is the most important consideration when evaluating the performance of SPR sensors. Eq. 6 illustrates how the resonance angle (Δθres) varies with a unit change in the analyte medium's RI (Δns), which is known as sensitivity.[19]
S = Δθres / Δns (°/RIU) (6)
The sensor's ability to precisely determine the resonance angle is indicated by DA, which represents the sharpness of the SPR reflectance curve. Eq. 7 defines it.
DA = 1/FWHM (1/°) (7)
Higher DA is obtained with a narrow resonance dip. FWHM is the SPR resonance curve's angular width calculated at half of the Rmin value. A smaller FWHM indicates improved sensing resolution, less energy loss, and a sharper resonance response. The Eq. 8 uses the FoM, which combines resonance sharpness and sensitivity, to assess the overall sensing capability.
FoM = S / FWHM = S × DA (/RIU) (8)
3. Results and discussion
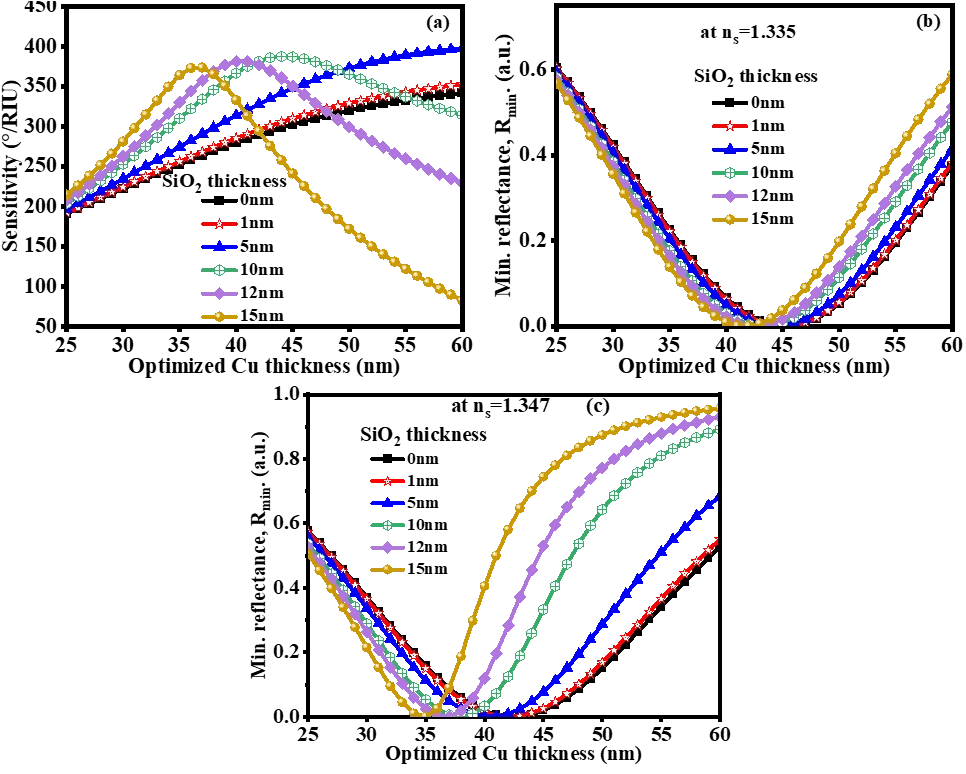
The optimization of the proposed SPR sensor is illustrated in Fig. 2 by examining the impact of Cu and SiO2 thicknesses on the sensing response. Fig. 2(a) shows the angular sensitivity as a function of the optimized Cu thickness for the SiO2 thicknesses (0, 1, 5, 10, 12, and 15 nm), showing that the SiO2 layer has a significant effect on the optimum Cu thickness and sensitivity. As Cu thickness reaches its optimal value, the sensitivity increases, followed by a decrease or saturation. This indicates that an appropriate Cu thickness is crucial for effective excitation of the surface plasmon mode. The Cu/SiO2 combination is optimized to achieve a maximum sensitivity of approximately 380–400 °/RIU. Fig. 2(a) shows that the ideal Cu thickness and maximum sensitivity are both significantly influenced by the SiO2 thickness. In the absence of SiO2, the sensitivity rises steadily with Cu thickness and approaches the upper Cu-thickness range at about 191.08–341.57 °/RIU. The sensitivity increases significantly with 1 nm SiO2, approaching 191.98–352.27 °/RIU. The sensitivity increases significantly with 5 nm SiO2, ranging from 196.33–397.44 °/RIU. The sensitivity variation for 10 nm SiO2 is 203.73–387.127 °/RIU (from 44 nm) and then decreases to 313.93 (60 nm) at a Cu thickness of 25–60 nm. At SiO2 = 12 nm, the sensitivity variation is 207.45–381.11 °/RIU (from 41 nm) and then decreases to 229.23 °/RIU (60 nm). And at SiO2 = 15 nm, the sensitivity varies from 214.19–373.37 °/RIU (from 37 nm) and then decreases to 81.88 °/RIU (60 nm). As a result, the SiO2 layer alters the electromagnetic field distribution at the sensing interface and adds an extra dielectric/plasmonic coupling region.
The two investigated glucose conditions are represented by the minimum reflectance (Rmin) for glucose RIs of 1.335 (0–0.015 g/dl) and 1.347 (10 g/dl), respectively, in Figs. 2(b) and 2(c). The SPR resonance condition is represented by the deep minimum in each curve in Fig. 2(b). Stronger coupling between the incident p-polarized light and the surface plasmon mode is indicated by a lower Rmin. The Rmin value for SiO2 = 0 and 1 nm occurs at roughly 42–47 nm Cu thickness. The minimum gradually moves toward lower Cu thickness (45 nm), as the SiO2 thickness increases to 5, 10, 12, and 15 nm. This shift demonstrates that the dielectric SiO2 layer alters the Cu layer's effective optical environment, which in turn alters the SPR coupling condition. Stronger plasmon excitation and a sharper resonance are indicated by curves with deeper minima, which are ideal for precise glucose detection. In Fig. 2(c), the increased glucose RI alters the optical boundary condition at the sensing interface, which significantly modifies the Rmin value when compared to Fig. 2(b). Depending on the SiO2 thickness, the Rmin value occurs between 36 and 40 nm Cu thickness. The Rmin value is near 37–38 nm for SiO2 = 0 and 1 nm, while the resonance position is systematically altered when 5–15 nm SiO2 is added. Specifically, the reflectance response is significantly shifted and broadened by the 12–15 nm SiO2 layers. The suggested glucose sensor is based on this behavior, which shows that the glucose-induced RI variation can be converted into a quantifiable SPR response. As Cu and SiO2 thicknesses increase, the distinct SPR dips shift as well. This is due to the alteration of the effective optical environment and electromagnetic-field distribution at the Cu/BlueP/Franckeite/analyte interface caused by the dielectric SiO2 layer. The alterations in resonance condition between ns = 1.335 and ns = 1.347 confirm that the proposed multilayer structure is responsive to fluctuations in the RI caused by glucose. CaF2 functions as the optical coupling prism, Cu plays a role in the surface plasmon excitation, SiO2 acts as a dielectric spacer and adjusts the plasmonic coupling, while BlueP and Franckeite enhance the light-matter interaction at the sensing interface. Therefore, it is crucial to increase the thicknesses of Cu and SiO2 to achieve a robust, well-defined SPR response and improve the glucose-sensing sensitivity of the proposed structure.
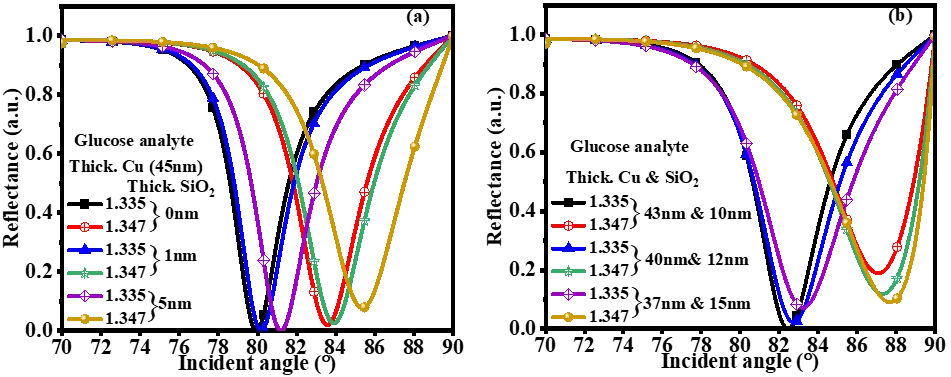
The angular reflectance curve of the suggested SPR sensor for various combinations of Cu and SiO2 thicknesses is shown in Fig. 3. When the phase-matching condition between the incident light and surface plasmon polaritons (SPPs) is met, the Rmin value seen in the curves corresponds to the excitation of SPW at the metal–dielectric interface. The incident optical energy is effectively transferred from the CaF2 prism to the plasmon mode at the resonance angle, causing a dramatic drop in reflected intensity. This resonance dip's location is extremely sensitive to changes in the glucose analyte's RI, which serves as the foundation for the sensing mechanism.
In Fig. 3(a), the SiO2 layer thickness varies while the Cu thickness is kept at 45 nm. The resonance dip gradually moves toward higher incident angles as the SiO2 thickness increases, indicating a change in the multilayer structure's effective refractive index. The SiO2 layer controls the evanescent field's penetration from the Cu surface toward the BlueP/Franckeite sensing region by acting as a dielectric spacer. A deeper resonance dip and increased sensitivity result from improved plasmon-analyte interaction and field confinement brought about by an appropriate SiO2 thickness. Excessive dielectric thickness, however, can widen the resonance curve and lower coupling efficiency. The thicknesses of Cu and SiO2 are changed simultaneously in Fig. 3(b). The Cu layer is a key factor in plasmon excitation strength. Strong plasmon resonance may not be supported by an excessively thin Cu layer, while excessive absorption of incident light occurs before it reaches the sensing interface when the Cu thickness is too large. To achieve effective plasmon excitation and maximum optical energy transfer to the surface plasmon mode, an ideal Cu thickness is therefore necessary. The observed variations in dip depth and resonance angle show that SPR performance is highly dependent on metal thickness.
By raising the local electromagnetic field intensity at the sensing interface, the addition of BlueP and Franckeite layers improves the sensor's performance even more. These 2D materials allow for better adsorption of glucose molecules and stronger perturbation of the plasmon field due to their high carrier mobility, large surface area, and strong light-matter interaction. As a result, even a slight variation in the glucose RI results in a discernible shift in the resonance angle. Better DA, a lower FWHM, and a higher FoM are all indicated by the deeper and sharper reflectance curves. Therefore, Fig. 3 shows that the suggested glucose SPR sensor's plasmonic coupling efficiency, field enhancement, and overall sensing performance can be greatly enhanced by carefully optimizing the Cu and SiO2 layers in combination with BlueP and Franckeite. The SPR performance for various Cu and SiO2 thickness combinations is summarized in Table 1. The sensitivity improves from 302.33 to 385.55 °/RIU as the SiO2 thickness increases from 0 to 10 nm, suggesting a stronger interaction between the glucose analyte and the evanescent field. Cu = 43 nm and SiO2 = 10 nm yield the highest sensitivity of 385.55 °/RIU. Nevertheless, the sensitivity decreases to 381.11 and 373.37 °/RIU, respectively, when the SiO2 thickness is increased to 12 and 15 nm. As SiO2 thickness increases, the FWHM typically rises while the DA falls. For Cu = 45 nm and SiO2 = 5 nm, the FoM reaches a maximum value of 103.67 /RIU, indicating the best overall balance between sensitivity and resonance sharpness. Accordingly, 43 nm Cu/10 nm SiO2 offers the highest angular sensitivity, while 45 nm Cu/5 nm SiO2 can be regarded as the ideal combination based on FoM.
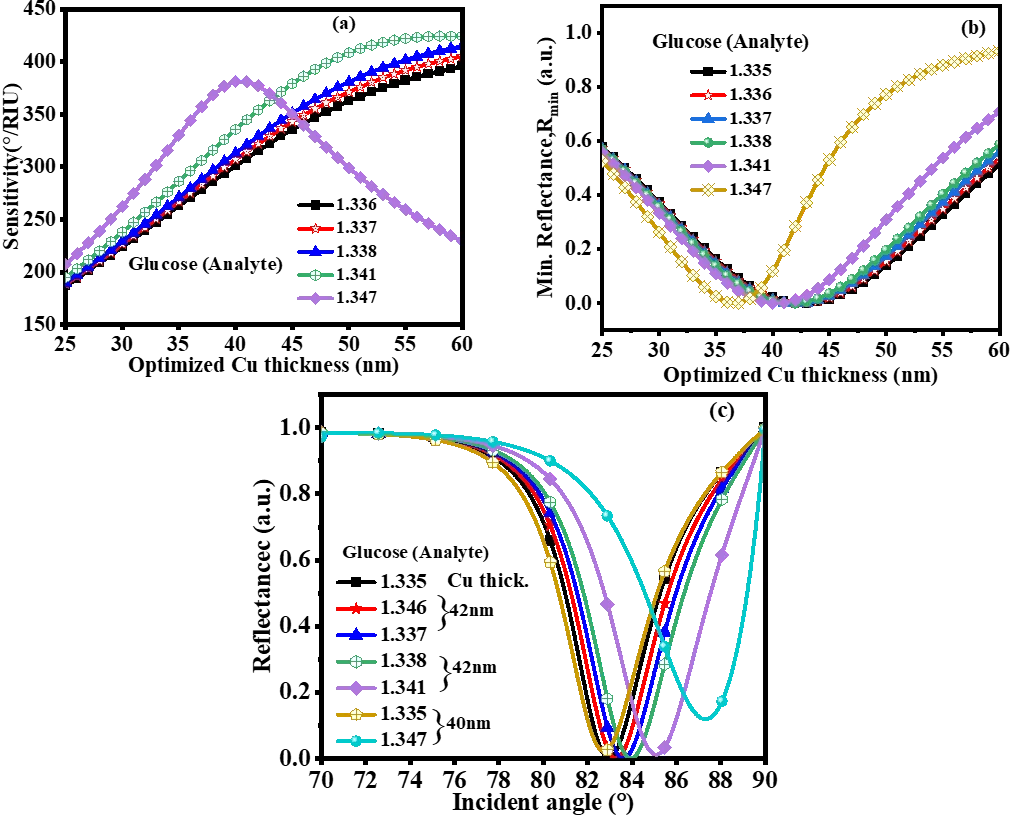
The SPR response of the proposed sensor is influenced by Cu thickness and glucose concentration, as illustrated in Fig. 4. Angular sensitivity with optimized Cu thickness varies for different glucose refractive indices, ranging from 1.335 to 1.347, as shown in Fig. 4(a). Initially, the sensitivity increases with the thickness of Cu, reaching a peak value of approximately 385 °/RIU at a depth of 42 to 43 nm Cu thickness. Subsequently, it gradually diminishes. The dependence of plasmonic coupling and electromagnetic-field penetration on the Cu thickness is the reason for this behavior; an excessively thick layer increases optical absorption and reduces coupling efficiency, whereas a very thin layer provides insufficient plasmon excitation. The corresponding variation of minimum reflectance (Rmin) is shown in Fig. 4(b), where a prominent minimum is seen close to the optimized Cu thickness, indicating effective energy transfer from the incident light to the surface plasmon mode. The reflectance curves for various glucose refractive indices are displayed in Fig. 4(c), where clear resonance dips are seen, and their locations systematically change as the glucose refractive index changes. Changes in glucose concentration alter the sensing medium's refractive index, which alters the SPR phase-matching condition and causes this resonance-angle shift. Strong plasmonic coupling is indicated by the deep and sharp resonance dips found close to the optimized Cu thickness, which also make it possible to detect minute changes in RI. Overall, the findings show that the structure is appropriate for glucose sensing because an ideal Cu thickness of roughly 42–43 nm offers a good balance between high sensitivity, low Rmin, and a sharp SPR resonance.
The SPR performance of the suggested sensor for urine glucose detection at various glucose concentrations and analyte refractive indices is shown in Table 2. When the refractive index shifts from 1.335 to 1.338 for the 42 nm Cu and 12 nm SiO2 configuration, the resonance-angle shift increases, and Δθres increases from 0.315° to 0.987°. As a result, the sensitivity rises from 315.69 to 329.25 °/RIU, indicating that the sensor is capable of accurately identifying minute variations in the RI brought on by glucose. Strong coupling between the incident light and the surface plasmon mode is indicated by the Rmin values, which stay extremely low and reach 2.7×10⁻⁶ a.u. at ns = 1.337. While the DA drops from 0.233 to 0.219 /°, the FWHM slightly increases from 4.29° to 4.55°. Good sensing performance is indicated by the FoM staying around 72 /RIU. With Rmin = 0.118 (a.u.), FWHM = 4.63°, DA = 0.215 /°, and FoM = 82.31 /RIU, the sensitivity for the 40 nm Cu and 12 nm SiO2 configuration is reported as 381.11 °/RIU. Table 3 thus shows that the sensor exhibits a quantifiable and systematic response to changes in glucose-induced RI, and that the optimized Cu/SiO2 thickness and corresponding resonance response offer good sensitivity and FoM for urine glucose detection.
| Conc. of glucose (g/dl) | RI of analyte | Cu Thick. (nm) | SiO2 Thick. (nm) | Δθres (°) | S (°/RIU) | Rmin (a.u.) | FWHM (°) | DA (1/°) | FoM (/RIU) |
|---|---|---|---|---|---|---|---|---|---|
| 0–15 mg/dl | 1.335 | 42 | 12 | – | – | – | 4.29 | 0.233 | – |
| 0.625 | 1.336 | 0.315 | 315.69 | 4.3×10⁻⁴ | 4.37 | 0.228 | 72.24 | ||
| 1.25 | 1.337 | 0.644 | 322 | 2.7×10⁻⁶ | 4.45 | 0.224 | 72.36 | ||
| 2.5 | 1.338 | 0.987 | 329.25 | 4×10⁻⁴ | 4.55 | 0.219 | 72.36 | ||
| 5.25 | 1.341 | 2.125 | 354.16 | 4.3×10⁻⁴ | 4.79 | 0.208 | 65.90 | ||
| 0–15 mg/dl | 1.335 | 40 | 12 | – | – | 2×10⁻² | 4.46 | 0.224 | 85.45 |
| 10 | 1.347 | 4.5733 | 381.11 | 0.11866 | 4.63 | 0.215 | 82.31 |
| Cu thick. (nm) | SiO2 thick. (nm) | S (°/RIU) | At ns = 1.335 | At ns = 1.347 | ||||||
|---|---|---|---|---|---|---|---|---|---|---|
| Rmin (a.u.) | FWHM (°) | DA (1/°) | FoM (/RIU) | Rmin (a.u.) | FWHM (°) | DA (1/°) | FoM (/RIU) | |||
| 45 | 0 | 302.33 | 1.5×10⁻⁴ | 2.99 | 0.334 | 101.11 | 1.9×10⁻² | 3.78 | 0.264 | 79.98 |
| 45 | 1 | 309.68 | 2.5×10⁻⁵ | 3.06 | 0.326 | 101.20 | 2.5×10⁻² | 3.86 | 0.259 | 80.22 |
| 45 | 5 | 347.30 | 8.8×10⁻⁴ | 3.35 | 0.298 | 103.67 | 7.7×10⁻² | 4.25 | 0.235 | 81.71 |
| 43 | 10 | 385.55 | 2×10⁻⁴ | 4.05 | 0.246 | 95.19 | 0.188 | 4.21 | 0.237 | 91.58 |
| 40 | 12 | 381.11 | 2.1×10⁻² | 4.46 | 0.224 | 85.45 | 0.118 | 4.63 | 0.215 | 82.31 |
| 37 | 15 | 373.37 | 7.1×10⁻⁴ | 4.84 | 0.206 | 77.14 | 9×10⁻² | 4.81 | 0.207 | 77.62 |
3.1 Electric field analysis
The electromagnetic response derived from the analytical/TMM model is validated through numerical investigation of the suggested SPR sensor using COMSOL Multiphysics, which is based on the finite element method (FEM). The sensor geometry is built in accordance with the multilayer configuration, and the electric-field distribution and reflectance characteristics are calculated using Electromagnetic Waves, Frequency Domain (ewfd) physics. The prism boundary introduces the incident optical wave, and the proper port/scattering boundary conditions are applied to ensure that the reflected field is properly excited and detected. Perfectly Matched Layers (PMLs) are used to terminate the computational domain's outer boundaries in order to accurately represent an open optical environment by absorbing outgoing electromagnetic waves and suppressing artificial reflections from the computational boundaries.
In COMSOL Multiphysics, a mesh-convergence analysis was carried out to ensure the accuracy and repeatability of the FEM results. The mesh was gradually improved, and following each improvement, the electric-field distribution and computed resonance characteristics were tracked. When additional refinement produced a negligible variation in the computed resonance response (less than 1%), mesh convergence was deemed accomplished. For all of the FEM simulations shown in this work, the converged mesh was subsequently used. This process reduces numerical discretization errors at a manageable computational cost. At the Cu/SiO2/BlueP/Franckeite/analyte interfaces, where the electric field varies quickly due to the excitation of surface plasmon polaritons, a fine and non-uniform mesh is used with strong mesh refinement. In areas where the electromagnetic field varies slowly, relatively coarser elements can be utilized to lower computational costs without sacrificing accuracy.
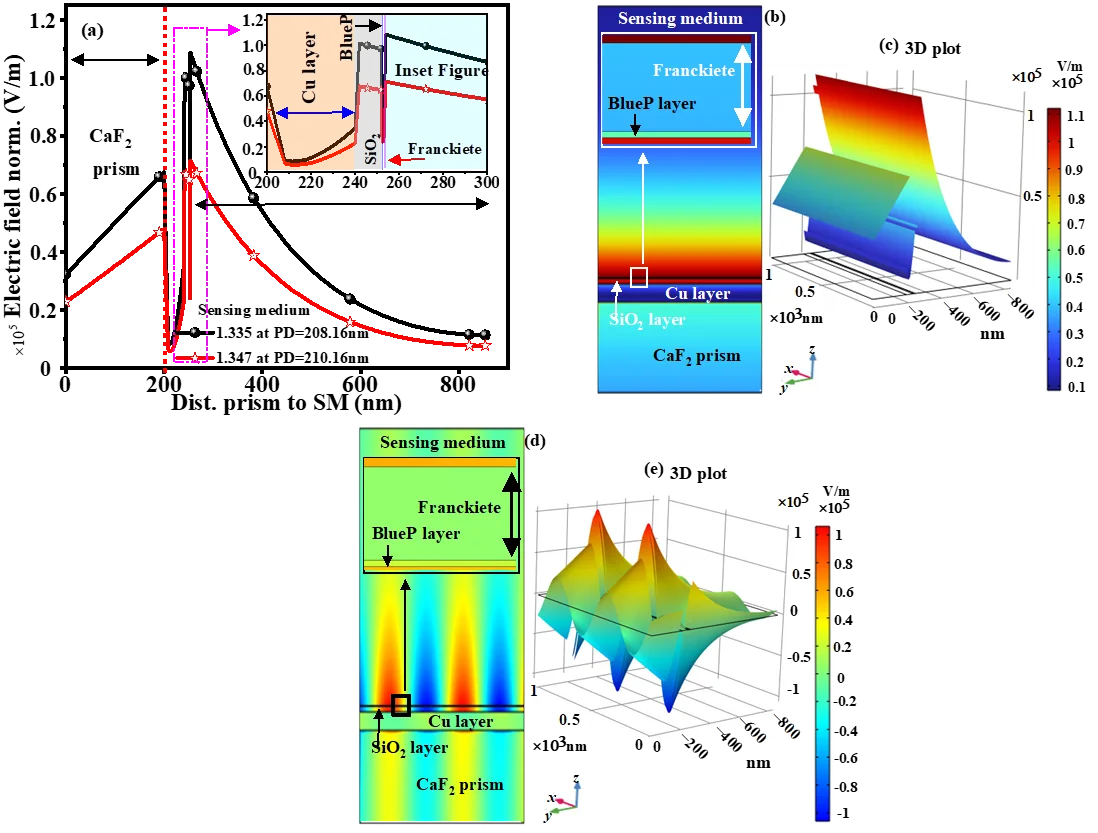
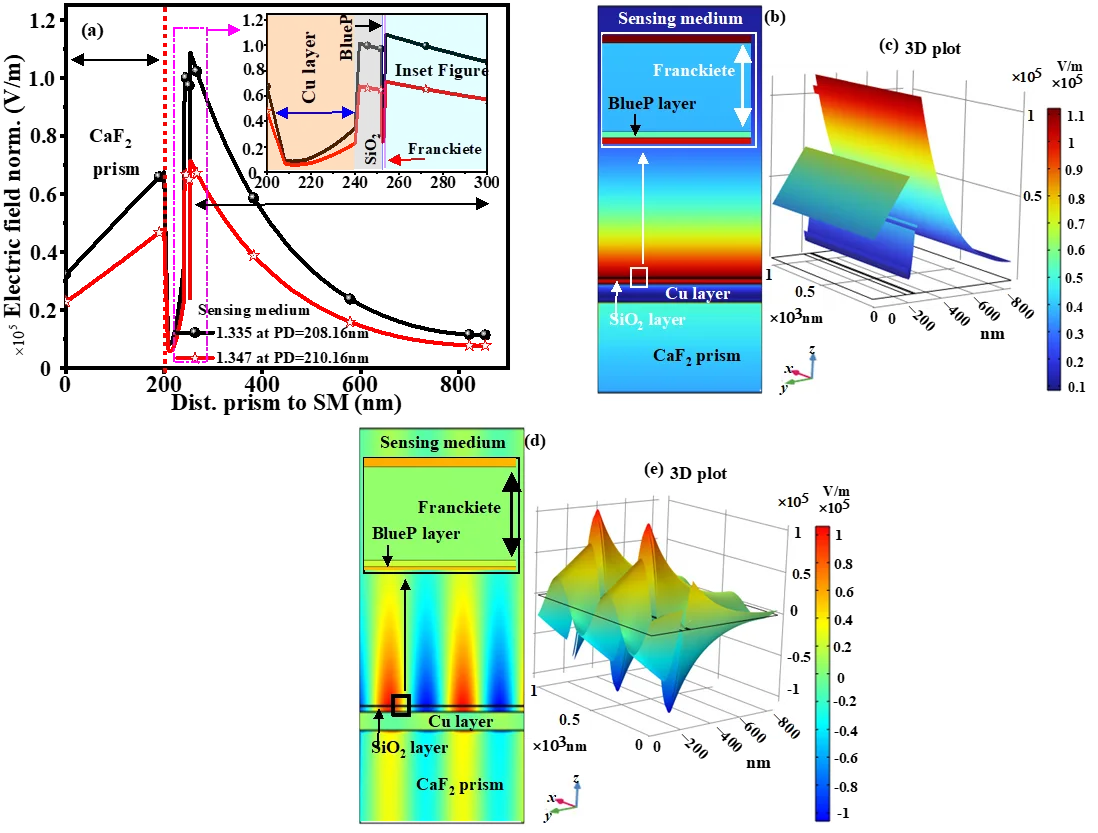
The metal-dielectric sensing interface exhibits a robust localized electric field, indicating efficient excitation of the SPR mode. Conversely, the systematic alteration in resonance condition with analyte RI demonstrates the feasibility of the proposed sensor for glucose detection. The penetration depth (PD) of the evanescent electromagnetic field in an SPR sensor is frequently calculated using the 1/e factor, or roughly 37%. The electric field intensity drops exponentially as it moves from the sensing surface into the analyte when surface plasmon resonance is excited at the metal–dielectric interface. The distance from the metal–analyte interface at which the electric field intensity drops to 1/e, or roughly 37% of its maximum value at the interface, is known as the PD.
Mathematically, the intensity distribution can be expressed as I(z) = I0·e−z/PD, where I0 is the maximum field intensity at the sensing interface and z is the distance from the interface. At z = PD, I(z) = I0/e ≈ 0.368I0. Consequently, the penetration depth of the evanescent field in COMSOL Multiphysics is calculated using the 37% intensity level as a reference.[20] A greater penetration depth means that the electromagnetic field penetrates the glucose/analyte medium more deeply, increasing the volume of interaction between the analyte molecules and the evanescent field. However, because the field becomes less localized at the sensing interface, an overly deep penetration depth is not always ideal. Therefore, the 1/e criterion offers a consistent and physically significant way to measure the effective sensing depth and assess the performance of the suggested SPR sensor.
The electric-field-normalized distribution and SPP mode of the suggested SPR sensor, as determined by COMSOL Multiphysics, is shown in Fig. 5. The normalized electric-field intensity is plotted against the distance from the CaF2 prism to the SM in Fig. 5(a). The excitation of the SPR mode is confirmed by a strong enhancement of the electric field near the Cu/SiO2/BlueP/Franckeite sensing interface. The SPP field's evanescent nature is demonstrated by the field's gradual decrease with increasing distance from the metal interface. The penetration depth of the evanescent field into the sensing medium is determined using the horizontal reference associated with the 1/e (≈37%) criterion; the marked PDs are roughly 205–210 nm for the analyte conditions under consideration. An enlarged view of the field enhancement surrounding the multilayer sensing region is shown in the inset of Fig. 5(a), which amply illustrates the strong localization of the electromagnetic field close to the Cu and nearby 2D-material layers. Effective confinement of the plasmonic field is confirmed by the 2D electric-field distribution shown in Fig. 5(b), where the field is strongly concentrated at the metal–dielectric/sensing interface and gradually decays away from the interface. The corresponding 3D SPP-mode distribution is displayed in Fig. 5(c), which offers a more accurate depiction of the electric field's strong localization and spatial variation surrounding the sensing region. Comparably, another 2D field-distribution view of the multilayer structure is shown in Fig. 5(d). Its corresponding 3D representation is shown in Fig. 5(e). These distributions' alternating the high- and low-field regions show the electromagnetic-field variation connected to the excited plasmon mode. Overall, effective SPP excitation is confirmed by the strong electric-field enhancement at the Cu/SiO2/BlueP/Franckeite/glucose interface, which also shows that the evanescent field interacts with the glucose sensing medium sufficiently to achieve high refractive-index sensitivity.
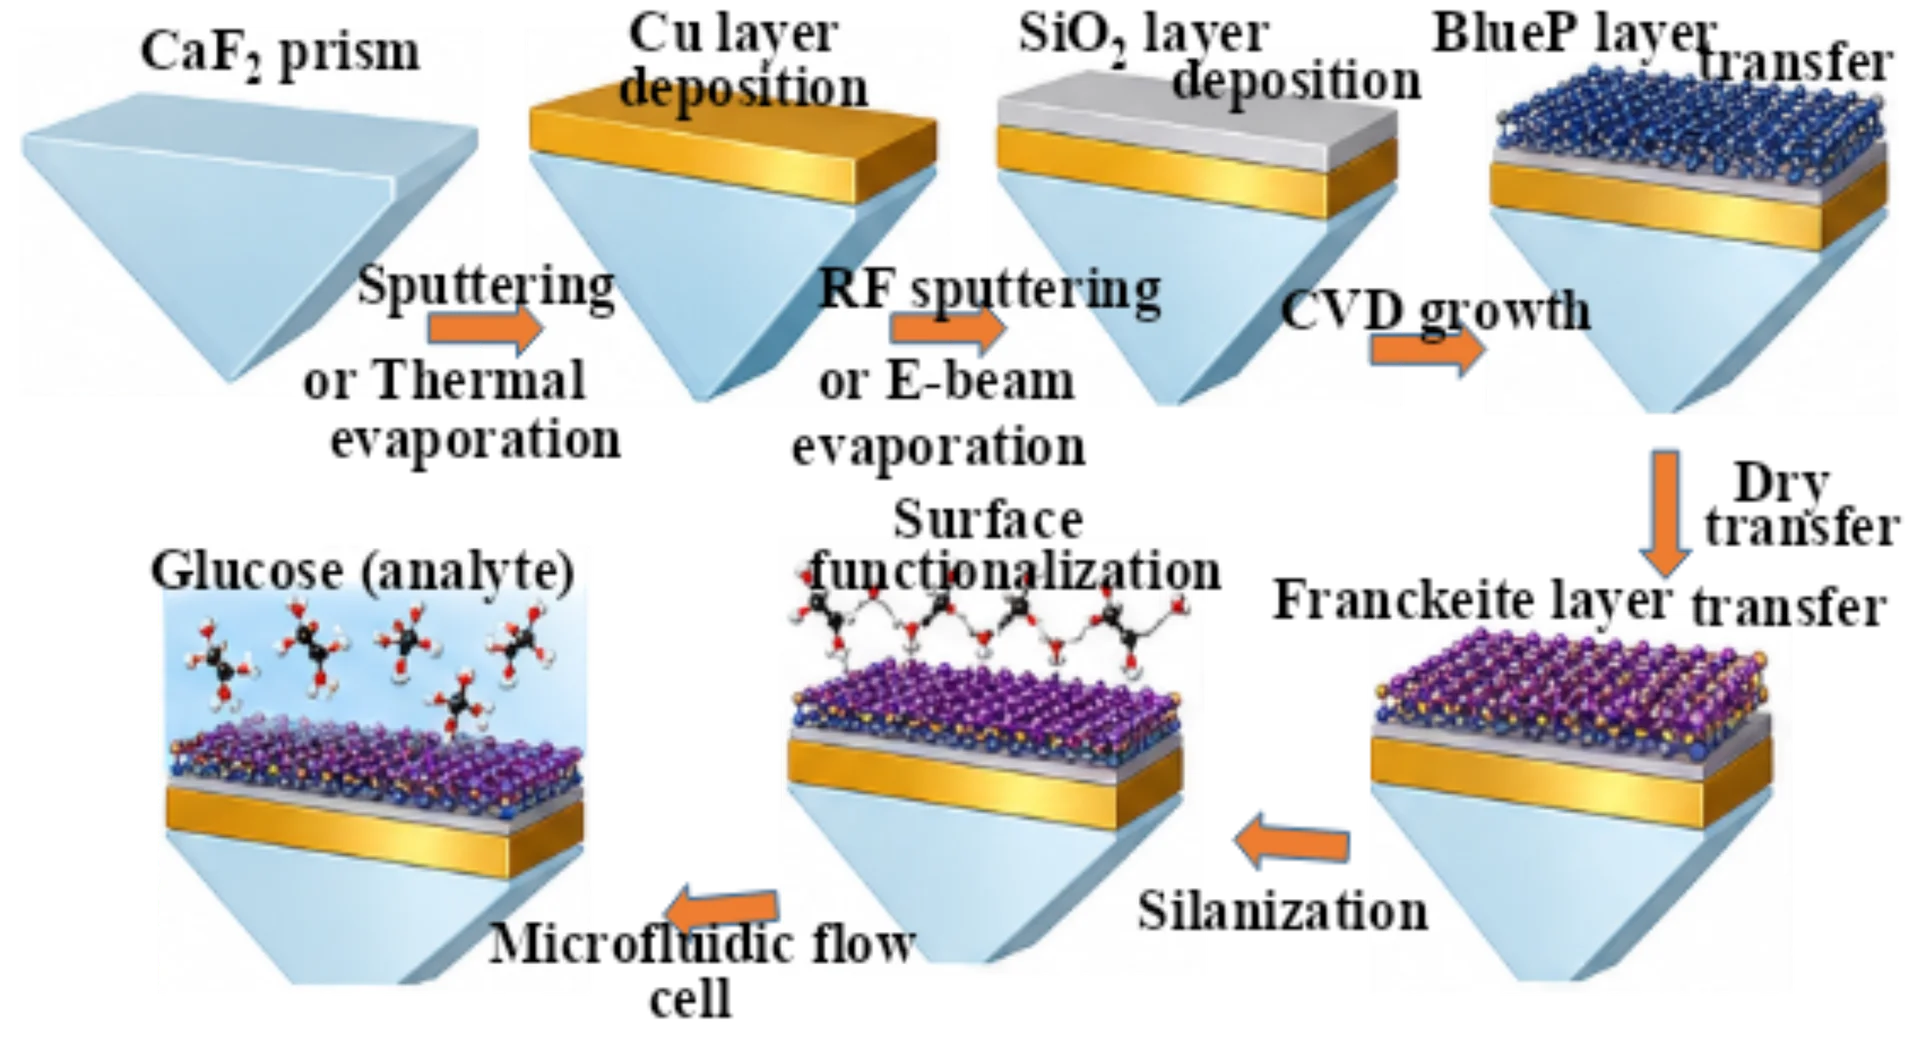
Using proven thin-film deposition and 2D material integration techniques, the suggested SPR sensor is fabrication feasible process as shown in Fig. 6. The CaF2 prism surface can be gently cleaned with acetone and isopropyl alcohol (IPA) to get rid of organic residues and contaminants before fabrication.[7] After a quick rinse with deionized water, it is dried with either clean air or filtered nitrogen. The CaF2 surface may be harmed by prolonged exposure to harsh chemicals and abrasive wiping. The Cu, SiO2, BlueP, and Franckeite layers can then be sequentially deposited using the cleaned prism. An optimized Cu layer of about 30–50 nm can be deposited using DC magnetron sputtering or thermal/electron-beam evaporation after a polished CaF2 prism has been cleaned and used as the optical coupling substrate.[21] Sputtering, evaporation, or other controlled thin-layer techniques can then be used to deposit a thin SiO2 dielectric spacer of about 5–15 nm over the Cu layer.[22] After mechanical exfoliation and controlled dry or wet transfer, atomically thin layers of BlueP (0.123 nm) and Franckeite (1.8 nm) can be integrated onto the SiO2 surface.[23,24] Because BlueP might be susceptible to environmental deterioration, its structural and optical qualities can be maintained through careful processing and appropriate encapsulation. After that, the created multilayer can be combined with a microfluidic chamber to add glucose solutions at precise concentrations. Changes in glucose concentration alter the analyte layer's effective RI, resulting in a discernible change in the SPR resonance angle. Deviations from the optimal numerical model may be caused by practical factors like surface roughness, transfer-induced defects, layer-thickness variations, interface contamination, and environmental stability, but these are fabrication and optimization considerations rather than fundamental limitations. Therefore, the suggested multilayer architecture offers a feasible route for glucose RI sensing and fabrication feasibility.
Because the numerical model for the proposed SPR sensor assumes ideal and time-invariant material properties, stability and repeatability are crucial practical considerations. Maintaining a steady SPR response over a predetermined amount of time when the sensor is exposed to the analyte is referred to as stability. While the BlueP/Franckeite layers alter the optical response and sensing interface, the SiO2 layer offers the underlying Cu layer a helpful protective and dielectric barrier. However, Cu oxidation, environmental degradation of BlueP, moisture or contamination at the 2D-material interfaces, temperature fluctuations, and changes in the optical constants of the ultrathin layers could all have an impact on the long-term stability of the suggested structure. To reduce degradation, BlueP may specifically need appropriate encapsulation or regulated environmental conditions. Repeatability is the process of measuring the same glucose concentration repeatedly under identical experimental conditions, resulting in nearly identical resonance angles and sensitivity values. For good repeatability, the Cu and SiO2 thicknesses must be uniform, the transfer and coverage of BlueP and Franckeite must be consistent, the concentration of the analytes must be stable, the temperature must be controlled, and microfluidic delivery must be reproducible. However, because the current numerical analysis does not include material aging, oxidation, fabrication imperfections, surface roughness, temperature effects, or repeated measurement cycles, it cannot independently establish experimental repeatability or long-term stability. Thus, to quantitatively establish stability, repeatability, and sensor-to-sensor reproducibility, experimental measurements involving multiple independently fabricated sensors and repeated glucose exposure–washing cycles are required, while the predicted performance should be regarded as an ideal numerical assessment.
For the suggested SPR sensor to be implemented practically, the fabrication tolerance of the ultrathin BlueP and Franckeite layers is crucial. Small variations from the ideal layer thickness can alter the multilayer structure's effective optical response, which in turn affects the resonance angle, Rmin value, FWHM, and sensing performance. Such variations may result from surface roughness, layer uniformity, thickness-control accuracy, and the deposition process in practical fabrication. Therefore, to replicate the optimal numerical performance, the ultrathin material thickness must be precisely controlled. While suitable deposition and thickness-characterization methods would be needed for experimental implementation, the thickness values taken into consideration in this study should be viewed as nominal optimized parameters. Future work will take into account a systematic tolerance analysis, experimental validation and testing with real urine samples to evaluate the sensor. The sensitivity and FoM of the suggested sensor are contrasted with those of previously published SPR sensors in Table 4. The suggested structure shows enhanced RI detection capability with a much higher sensitivity of 381.11 °/RIU. Despite this, its FoM (82.31 /RIU) is marginally lower than Ref. 27, it provides a good overall sensing performance and is still competitive with the reported structures.
| References | Structure | Wavelength (nm) | S (°/RIU) | FoM (/RIU) |
|---|---|---|---|---|
| [17] | Prism/Ag/MXene/Ag/ZnO/Graphene | 633 | 184 | 27.23 |
| [25] | BK7/Au/MoS2/h-BN/Graphene | 633 | 194.12 | 16.04 |
| [26] | BK7/Au/PtSe2/Graphene | 633 | 200 | – |
| [27] | BK7/MgO/Ag/BP | 633 | 234 | 38.18 |
| [28] | Prism/Ag/Graphene/WS2 | 633 | 288.86 | 88.89 |
| Proposed work | CaF2/Cu/SiO2/BlueP/Franckeite | 633 | 381.11 | 82.31 |
4. Conclusion
The proposed structure was used in this work to numerically investigate a multilayer SPR sensor for urine glucose detection. Cu and SiO2 thickness optimization showed that the thickness of the constituent layers has a significant impact on sensor performance. The optimized structures attained the remarkable DA and FoM, narrow reflectance curve, and higher sensitivity among the configurations examined. The optimization study yielded a maximum sensitivity of 385.55 °/RIU, indicating the robust response of the suggested structure to variations in the analyte RI for glucose detection. The sensor's sensitivity for the urine-glucose sensing range was 381.11 °/RIU at RI = 1.347, along with Rmin = 0.11866, FWHM = 4.63°, DA = 0.215 /°, and FoM = 82.31 /RIU. The suggested structure's suitability for glucose sensing is suitable by the systematic resonance-angle variation with rising glucose-related RI. More options for regulating the optical field and improving light-matter interaction at the sensing interface are made possible by the addition of BlueP and Franckeite layer. Moreover, the PD of 208.16 (at RI = 1.335) and 210.16 (at RI = 1.347) is achieved. As a result, the suggested sensor may be a viable platform for urine-based glucose monitoring that is non-invasive or minimally invasive. However, to determine its practical applicability, experimental fabrication, material-thickness tolerance analysis, temperature and environmental stability assessment, and validation using real urine samples are needed.
Acknowledgement
Not applicable.
CRediT Author Contribution Statement
Rajeev Kumar: Conceptualization, Methodology, Supervision, Writing—original draft preparation, Writing—review and editing. Lalit Garia: Formal analysis, Writing—original draft preparation. Biswajit Brahma: Methodology, Writing—original draft preparation. Akash Kumar Bhoi: Conceptualization, Formal analysis, Resources, Writing—review and editing. All authors have read and approved the final version of the manuscript for publication and agree to be accountable for all aspects of the work, ensuring that questions related to the accuracy or integrity of any part of the work are appropriately investigated and resolved.
Funding Declaration
This research did not receive any specific grant from funding agencies in the public, commercial, or not-for-profit sectors.
Data Availability Statement
All data generated or analysed during this study are included in this published article.
Conflict of Interest
Akash Kumar Bhoi serves as the Editor-in-Chief, Rajeev Kumar as the Managing Editor, and Biswajit Brahma as an Editorial Board Member. To ensure a rigorous and unbiased peer-review process, they were not involved in any stage from editorial evaluation, peer review process and final publication decision. The handling of this manuscript was managed independently by another editorial board member. The other author declares no competing interests.
Artificial Intelligence (AI) Use Disclosure
The authors declare that artificial intelligence (AI)-assisted tools were used only for language refinement, grammar improvement, and manuscript structuring purposes during the preparation of this work. All technical content, experimental implementation, results, and interpretations were independently developed and verified by the authors.
Supporting information
Not applicable.
References
- [1] R. Kumar, Y. Sharma, T. Sudhakar, S. M. M. R. Ray, B. Jain, A. Pal, Detection of Urine Glucose Concentration Using Zirconium Nitride Surface Plasmon Resonance Sensor, Plasmonics, 2025, 20, 5757–5766, doi: 10.1007/s11468-025-02853-4.
- [2] F. J. Service, G. D. Molnar, W. F. Taylor, Urine Glucose Analyses During Continuous Blood Glucose Monitoring, JAMA, 1972, 222, 294–298, doi: 10.1001/jama.1972.03210030020004.
- [3] A. L. Galant, R. C. Kaufman, J. D. Wilson, Glucose: Detection and Analysis, Food Chemistry, 2015, 188, 149–160, doi: 10.1016/j.foodchem.2015.04.071.
- [4] A. Yadav, A. Kumar, P. Sharan, M. Mishra, Highly Sensitive Bimetallic-Metal Nitride SPR Biosensor for Urine Glucose Detection, IEEE Transactions on NanoBioscience, 2023, 22, 897–903, doi: 10.1109/TNB.2023.3246535.
- [5] R. Mahalakshmi, J. Wekalao, M. R. Raja, S. A. Jothi, Ultra-Sensitive Graphene-Metal Hybrid Metasurface for Non-Invasive Glucose Detection with Convolutional Neural Network Integration, Plasmonics, 2026, 21, 549–574, doi: 10.1007/s11468-025-02989-3.
- [6] S. Mostufa, A. K. Paul, K. Chakrabarti, Detection of Hemoglobin in Blood and Urine Glucose Level Samples Using a Graphene-Coated SPR Based Biosensor, OSA Continuum, 2021, 4, 2164, doi: 10.1364/osac.433633.
- [7] R. Kumar, S. Pal, Y. K. Prajapati, S. Kumar, J. P. Saini, Sensitivity Improvement of a MXene-Immobilized SPR Sensor With Ga-Doped-ZnO for Biomolecules Detection, IEEE Sensors Journal, 2022, 22, 6536–6543, doi: 10.1109/JSEN.2022.3154099.
- [8] P. M. Tripathi, A. Sahu, Shivangani, S. Singh, R. Kumar, Bimetallic Multilayer SPR Biosensor Based on Multiferroic Perovskite Oxide and Graphene for Mycobacterium Tuberculosis Biomarker Detection, Microchemical Journal, 2026, 227, 118858, doi: 10.1016/j.microc.2026.118858.
- [9] Y. Cheng, T. Zhou, J. Wang, W. Quan, Y. Peng, X. Wang, H. Ding, Y. Zhang, Property Explorations and Applications of 2D Transition Metal Dichalcogenides Through Phase Engineering, Small, 2026, 22, e00049, doi: 10.1002/smll.202600049.
- [10] M. Bepare, T. P. Mondal, S. A. Rafi, R. R. Mahmud, M. S. Islam, B. Barua, Highly Sensitive Single-Core Surface Plasmon Resonance Biosensor for Detecting Six Different Cancer Cells Using Photonic Crystal Fiber, Plasmonics, 2026, 21, 871–888, doi: 10.1007/s11468-025-03273-0.
- [11] E. Bahmani, H. Kaatuzian, S. G. Shafagh, High-Performance Au–MoS2–Graphene Multilayer SPR Biosensor with Superior Sensitivity and Precision, Scientific Reports, 2026, 16, 8428, doi: 10.1038/s41598-026-39993-4.
- [12] H. Bouandas, R. Kumar, S. Singh, Y. Bouazzi, K. Sirohi, Enhanced sensitivity and figure of merit in surface plasmon resonance biosensors with silicon dioxide and barium titanate materials, Microchemical Journal, 2025, 212, 113341, doi: 10.1016/j.microc.2025.113341.
- [13] K. M. Ishtiak, S. A. Imam, Q. D. Khosru, BaTiO3-Blue Phosphorus/WS2 Hybrid Structure-Based Surface Plasmon Resonance Biosensor with Enhanced Sensor Performance for Rapid Bacterial Detection, Results in Engineering, 2022, 16, 100698, doi: 10.1016/j.rineng.2022.100698.
- [14] S. Singh, A. K. Sharma, P. Lohia, D. K. Dwivedi, Theoretical analysis of sensitivity enhancement of surface plasmon resonance biosensor with zinc oxide and blue phosphorus/mos2 heterostructure, Optik, 2021, 244, 167618, doi: 10.1016/j.ijleo.2021.167618.
- [15] Y. Mogulkoc, M. Modarresi, A. Mogulkoc, Y. O. Ciftci, Electronic and Optical Properties of Bilayer Blue Phosphorus, Computational Materials Science, 2016, 124, 23–29, doi: 10.1016/j.commatsci.2016.07.015.
- [16] A. M. Aygar, High Density, On-Chip, Alkali Doping of Graphene and the Characterization of the Electronic Structure of Franckeite, McGill University, Canada, 2023.
- [17] B. Karki, A. Uniyal, P. Sarkar, A. Pal, R. B. Yadav, Sensitivity improvement of surface plasmon resonance sensor for glucose detection in urine samples using heterogeneous layers: an analytical perspective, Journal of Optics, 2024, 53, 2567–2577, doi: 10.1007/s12596-023-01418-0.
- [18] M. B. Hossain, M. M. Rana, L. F. Abdulrazak, S. Mitra, M. Rahman, Design and Analysis of Graphene–MoS2 Hybrid Layer Based SPR Biosensor with TiO2–SiO2 Nano Film for Formalin Detection: Numerical Approach, Optical and Quantum Electronics, 2019, 51, 195, doi: 10.1007/s11082-019-1911-z.
- [19] A. Uniyal, A. Pal, G. Ansari, B. Chauhan, Numerical Simulation of InP and MXene-Based SPR Sensor for Different Cancerous Cells Detection, Cell Biochemistry and Biophysics, 2025, 83, 2895–2908, doi: 10.1007/s12013-025-01675-9.
- [20] A. Shalabney, I. Abdulhalim, Electromagnetic Fields Distribution in Multilayer Thin Film Structures and the Origin of Sensitivity Enhancement in Surface Plasmon Resonance Sensors, Sensors and Actuators A: Physical, 2010, 159, 24–32, doi: 10.1016/j.sna.2010.02.005.
- [20] K. R. Sinju, A. K. Debnath, N. S. Ramgir, Techniques for Thin Films of Advanced Materials, in Handbook on Synthesis Strategies for Advanced Materials: Volume-II: Processing and Functionalization of Materials, Springer, Singapore, 2022, 81–117.
- [21] H. Cheng, Metallic Nanotransistors, University of Canterbury Electrical & Computer Engineering, Christchurch, New Zealand, 2008.
- [22] S. Kuriakose, Thickness tailored synthesis of two dimensional materials and tuning their intrinsic properties: fundamentals to application, RMIT University, 2024, doi: 10.25439/rmt.27598626.
- [23] N. Sultana, A. Degg, S. Upadhyaya, T. Nilges, N. Sen Sarma, Synthesis, modification, and application of black phosphorus, few-layer black phosphorus (flbp), and phosphorene: a detailed review, Materials Advances, 2022, 3, 5557–5574, doi: 10.1039/d1ma01101d.
- [25] N. Mudgal, A. Saharia, A. Agarwal, J. Ali, P. Yupapin, G. Singh, Modeling of Highly Sensitive Surface Plasmon Resonance (SPR) Sensor for Urine Glucose Detection, Optical and Quantum Electronics, 2020, 52, 307, doi: 10.1007/s11082-020-02427-0.
- [26] S. Mostufa, A. K. Paul, K. Chakrabarti, Detection of Hemoglobin in Blood and Urine Glucose Level Samples Using a Graphene-Coated SPR Based Biosensor, OSA Continuum, 2021, 4, 2164–2176, doi: 10.1364/OSAC.433633.
- [27] S. Kumar, A. Yadav, B. A. Malomed, High Performance Surface Plasmon Resonance Based Sensor Using Black Phosphorus and Magnesium Oxide Adhesion Layer, Frontiers in Materials, 2023, 10, 1131412, doi: 10.3389/fmats.2023.1131412.
- [28] A. Yadav, M. Mishra, S. K. Tripathy, A. Kumar, O. P. Singh, P. Sharan, Improved Surface Plasmon Effect in Ag-Based SPR Biosensor with Graphene and WS2: An Approach Towards Low Cost Urine-Glucose Detection, Plasmonics, 2023, 18, 2273–2283, doi: 10.1007/s11468-023-01945-3.
Publisher Note
Publisher Note: The views, statements, and data in all publications solely belong to the authors and contributors. GR Scholastic is not responsible for any injury resulting from the ideas, methods, or products mentioned. GR Scholastic remains neutral regarding jurisdictional claims in published maps and institutional affiliations.
Open Access
This article is licensed under a Creative Commons Attribution-NonCommercial 4.0 International License, which permits the non-commercial use, sharing, adaptation, distribution and reproduction in any medium or format, as long as appropriate credit to the original author(s) and the source is given by providing a link to the Creative Commons License and changes need to be indicated if there are any. The images or other third-party material in this article are included in the article's Creative Commons License, unless indicated otherwise in a credit line to the material. If material is not included in the article's Creative Commons License and your intended use is not permitted by statutory regulation or exceeds the permitted use, you will need to obtain permission directly from the copyright holder. To view a copy of this License, visit: https://creativecommons.org/licenses/by-nc/4.0/
© The Author(s) 2026