

 Open Access||Research Article
Multimodal Biometric Authentication Using Fingerprint and Finger Vein Recognition: A Frozen Pre-Trained CNN Backbone Framework with Lightweight Classifiers

Department of Cyber Security, Imam Alkadhum College (IKC), Baghdad, Iraq
Abstract
Security systems that depend on a single biometric modality have well-known weaknesses, including vulnerability to presentation attacks and sensitivity to acquisition conditions. This work proposes a multimodal biometric framework that combines fingerprint and finger vein recognition for identity authentication. The distinguishing feature of the proposed approach is that no convolutional backbone is trained or fine-tuned at any stage: three ImageNet pre-trained architectures — VGG16, ResNet50 and EfficientNet-B0 — are used strictly as frozen feature extractors, and the only fitted components are two lightweight, low-capacity classifiers and two scalar attention weights. After extraction, Global Average Pooling (GAP) produces compact per-backbone descriptors that are L2-normalised and concatenated into a single 3,840-dimensional joint descriptor; Principal Component Analysis (PCA) then reduces this descriptor to 206 components for fingerprints and 283 components for finger veins while retaining 95% of the variance in each case. An attention module with channel, spatial and dynamic components is integrated to emphasise the most discriminative regions of the biometric image. For matching, fingerprint recognition uses a Random Forest classifier and finger vein recognition uses a K-Nearest Neighbour classifier; in both cases the accept/reject decision is taken on a calibrated cosine similarity score. The two modalities are combined through a conservative decision-level gate in which both must independently exceed a common calibrated threshold of 0.74 before access is granted, while a weighted score (0.6 fingerprint, 0.4 finger vein) is retained only as a logged confidence value. The system was evaluated on two public datasets — SOCOFing for fingerprints and SDUMLA-HMT for finger veins — linked by an explicitly documented virtual pairing protocol. Results show 98.90% accuracy for fingerprint recognition and 98.30% for finger vein recognition. After fusion the overall accuracy reaches 98.88% with an Equal Error Rate (EER) of 0.03%. Ten-fold subject-disjoint cross-validation gives 99.64% ± 0.43% mean accuracy (95% confidence interval 99.33%–99.95%). The system requires 156.2 ms per authentication request and about 24% of CPU on average on a machine with no GPU, which confirms that it can operate in environments with limited computational resources.
Keywords
Graphical Abstract
Novelty Statement
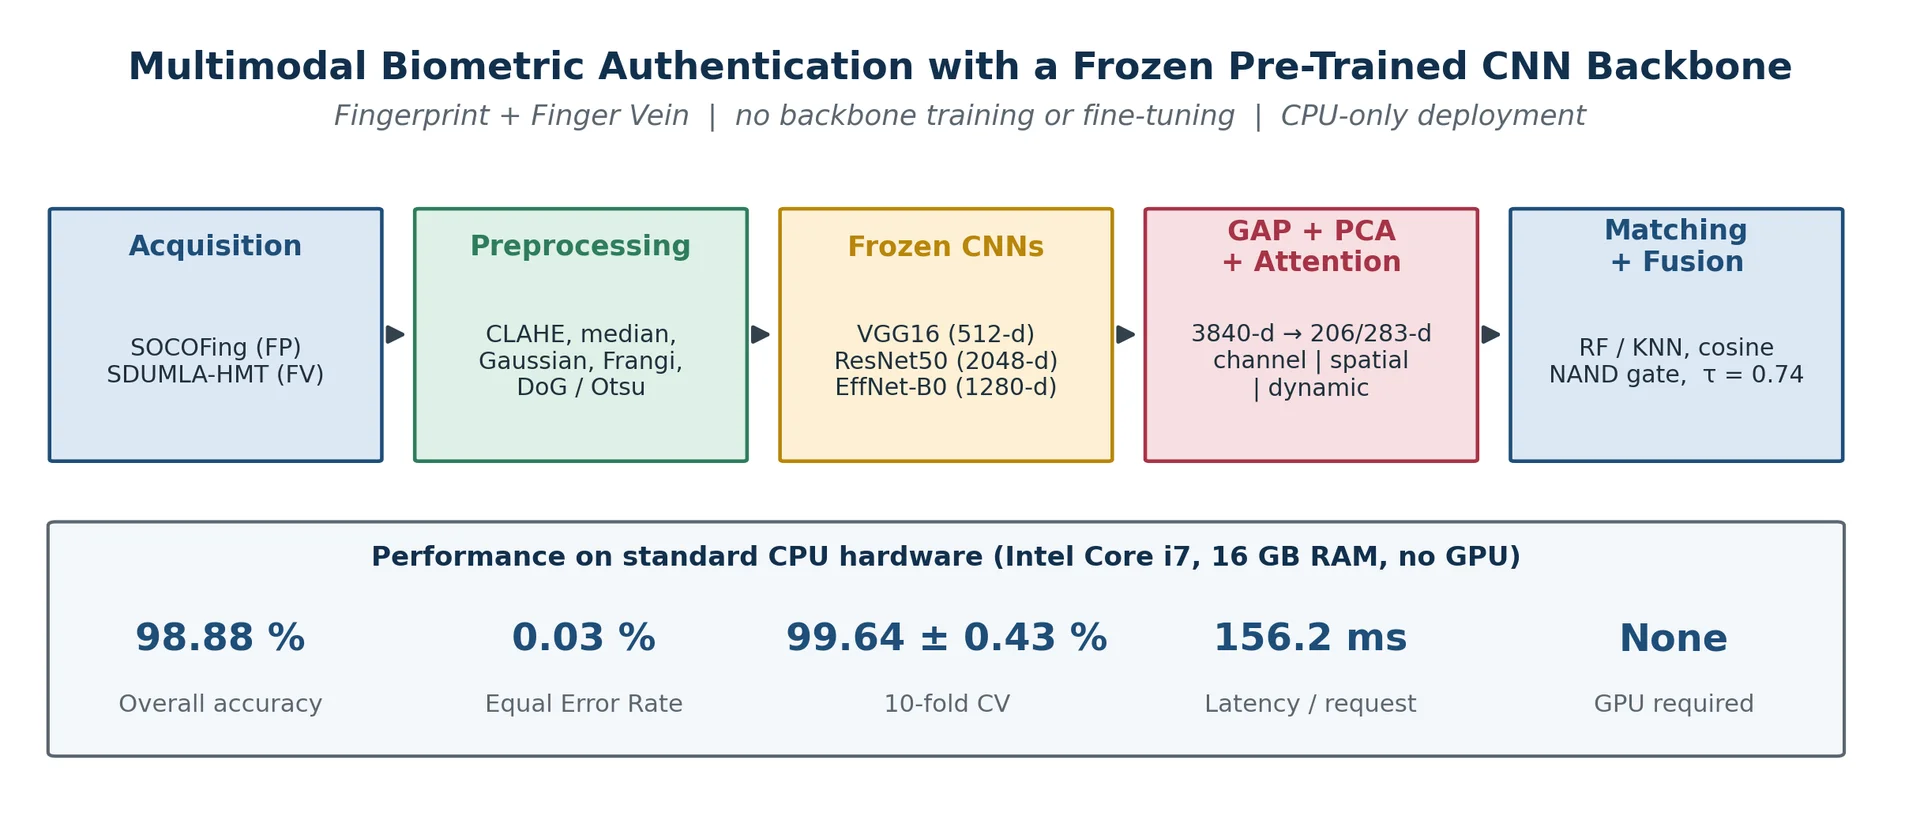
A frozen-backbone multimodal biometric framework integrates fingerprint and finger-vein features using PCA-reduced representations, Random Forest, KNN, and dynamic attention fusion, achieving 98.88% accuracy and 0.03% EER on standard CPU hardware without GPU-based retraining.
1. Introduction
Over recent decades the importance of secure and reliable identity verification has grown significantly. Classical methods such as passwords and smart cards are no longer considered sufficient, especially in high-security environments, because they are exposed to theft, duplication and social engineering.[1] For this reason, biometric authentication systems have received growing interest, since they rely on physical or behavioural characteristics that are naturally bound to the individual and much harder to forge.
Fingerprint recognition is among the most widely deployed biometric technologies. It is popular because it offers high accuracy, is easy to acquire and has a relatively low implementation cost.[2] It has been used in applications ranging from mobile device unlocking to national identification programmes. However, fingerprint-based systems have a known vulnerability to presentation attacks, in which artificial fingers are fabricated from high-resolution photographs or silicone replicas.[3]
Finger vein recognition has emerged as a strong complement to fingerprints. Finger vein patterns arise from the vascular structure beneath the skin, which is not externally visible and is therefore considerably more difficult to counterfeit.[4] These patterns are unique to each individual and stable over time. Finger vein systems are, however, more sensitive to illumination conditions and sensor quality than fingerprint systems.
Combining both modalities in a multimodal framework offers two important advantages. First, overall recognition accuracy increases because each modality compensates for weaknesses of the other. Second, presentation attacks become substantially harder, since an attacker must defeat two independent biometric channels simultaneously.[5] Several research groups have explored this combination with promising results.
The principal obstacle to deploying such systems is computational cost. Most published methods depend on training deep neural networks from scratch or fine-tuning pre-trained models on biometric data. This requires large labelled datasets, accelerator hardware and significant time, and in practice restricts where such systems can be installed. The present work addresses this obstacle by using pre-trained convolutional networks purely as fixed feature extractors, with no backbone weight ever updated, and by delegating the discriminative decision to lightweight classifiers operating on strongly compressed descriptors.
It should be stated precisely what is and what is not learned in the proposed framework, because the distinction matters for reproducibility and for a fair comparison with the literature. The three convolutional backbones are frozen: no gradient is propagated into them and no biometric image ever modifies their weights. What is fitted from data is limited to (i) the PCA basis, (ii) a Random Forest of 100 trees for the fingerprint branch, (iii) a K-Nearest Neighbour reference set for the finger vein branch, and (iv) the two scalar weights α and β of the dynamic attention branch. The framework is therefore described throughout this paper as a frozen-backbone rather than a fully training-free system; the earlier and looser characterization has been withdrawn.
The main contributions of this work are:
- A multimodal authentication framework in which no convolutional backbone is trained or fine-tuned, so that the entire pipeline executes on commodity CPU hardware and is suitable for low-resource deployment.
- A symmetric feature-extraction pipeline in which the same 3,840-dimensional multi-backbone descriptor (VGG16, ResNet50 and EfficientNet-B0 combined through GAP and L2 normalization) is built for both modalities and reduced by PCA under an identical 95 % variance criterion, giving a dimensionality reduction of 94.6 % for fingerprints and 92.6 % for finger veins.
- A three-component attention mechanism (channel, spatial, dynamic) that contributes 4.7 percentage points to fingerprint accuracy and 5.8 percentage points to finger vein accuracy relative to the corresponding ablated configurations, at a cost of only two learnable scalars.
- An explicitly specified two-stage decision procedure that separates the conservative per-modality gate from the weighted confidence score, removing the ambiguity between decision-level and score-level fusion, and that lowers the EER from 0.119 % (fingerprint alone) to 0.03 % after fusion.
- A fully documented experimental protocol, including the virtual pairing procedure, the hyper-parameter selection grid, the deployment cost model and confidence intervals on the cross-validation estimates, together with ten figures covering the architecture, the error trade-off characteristics and the confusion structure of both subsystems.
The remainder of this paper is organized as follows. Section 2 reviews related work and positions the present contribution against the closest published approaches. Section 3 describes the proposed methodology. Section 4 presents the experimental results, the statistical analysis and the comparative evaluation. Section 5 draws conclusions, states the limitations explicitly and outlines future directions.
3. Proposed methodology
3.1 System overview
The proposed system operates in five stages: image acquisition, modality-specific preprocessing, frozen CNN feature extraction, dimensionality reduction with attention-based enhancement, and calibrated matching with decision-level fusion as shown in Fig. 1. Fig. 2 shows the complete architecture, including the data volumes at each interface and the point at which the two modality branches converge. Each stage is described in the subsections that follow.
Fig. 1: Schematic of the proposed framework: acquisition, modality-specific preprocessing, frozen multi-backbone feature extraction, GAP–PCA reduction with three-component attention, and calibrated matching with a conservative decision-level gate.
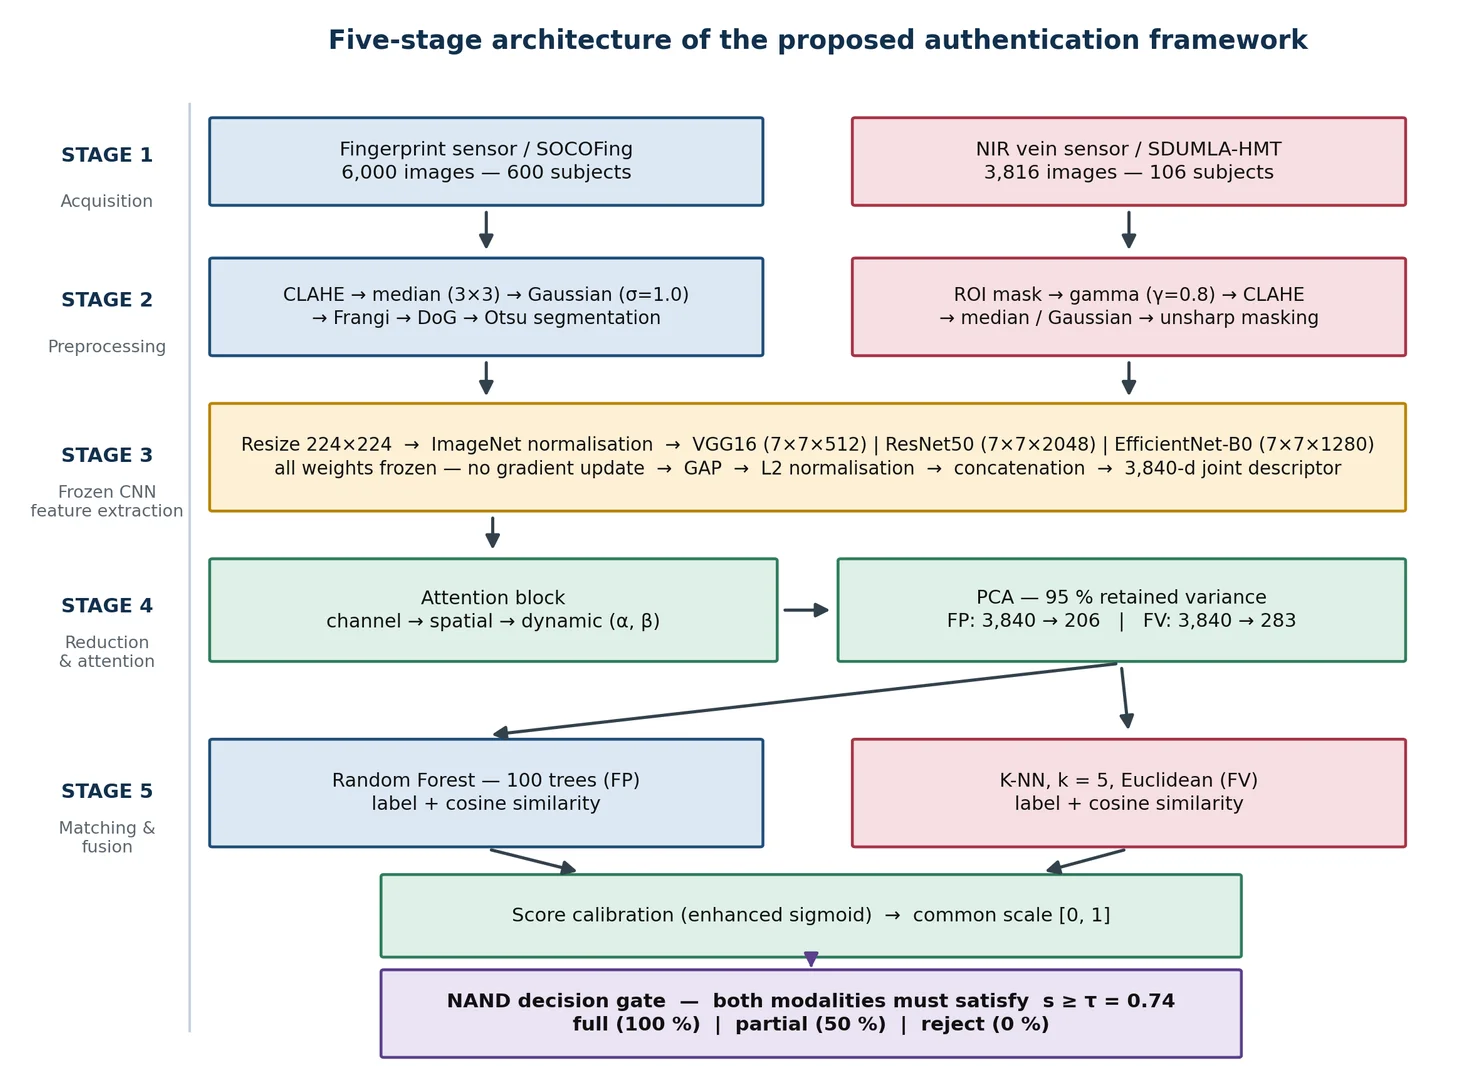
Fig. 2: Five-stage architecture of the proposed authentication framework. The two modality branches remain independent through preprocessing, extraction and matching, and converge only at the decision gate.
3.2 Datasets and the virtual pairing protocol
Two publicly available datasets are used. The SOCOFing database contains 6,000 fingerprint images from 600 subjects, with ten impressions per subject, acquired under controlled conditions. The SDUMLA-HMT database provides 3,816 finger vein images from 106 subjects, captured under varying illumination and finger positioning, which makes it a more demanding evaluation environment.
No public dataset contains both fingerprint and finger vein images of the same individuals, so a virtual pairing protocol is required to evaluate fusion. The original description was insufficient to reproduce; the procedure is now specified in full.
- The number of virtual identities is bounded by the smaller subject population and was fixed at 106, equal to the number of SDUMLA-HMT subjects. No subject is repeated and no identity is duplicated.
- Virtual identity i is formed by binding SDUMLA-HMT subject i to SOCOFing subject i under a fixed, deterministic one-to-one index map established once, before any data splitting, and never altered thereafter. The map is index-based rather than similarity-based, so no feature information is used to construct it.
- Each virtual identity contributes min(n_FP,i , n_FV,i) paired samples, where n_FP,i = 10 fingerprint impressions and n_FV,i = 36 finger vein images on average; the effective number of fusion trials per identity is therefore governed by the fingerprint count.
- The remaining 494 SOCOFing subjects are not discarded. They are used exclusively for the unimodal fingerprint evaluation reported in Section 4.2 and as an impostor population for the fingerprint subsystem, and they never enter the fusion experiments.
- Cross-validation folds are formed over virtual identities, not over samples. When virtual identity i is assigned to a test fold, both its fingerprint subject and its finger vein subject are removed from every training partition simultaneously, so no subject can appear on both sides of a split in either modality.
The limitation inherent to this design is acknowledged explicitly: virtual pairing establishes an arbitrary correspondence between two independent populations and therefore cannot reproduce any genuine physiological correlation between a person's fingerprint and vein pattern. The consequence for fusion is discussed quantitatively in Section 4.7.
3.3 Image preprocessing
Before feature extraction, each image passes through a modality-specific filter chain designed to suppress acquisition noise and to enhance the ridge or vascular structure. For fingerprint images the chain is: CLAHE for local contrast enhancement, median filtering with a 3×3 kernel for impulse noise removal, Gaussian filtering with σ = 1.0 for smoothing, Frangi filtering for ridge enhancement, Difference of Gaussian filtering for edge emphasis, and Otsu thresholding for foreground segmentation. For finger vein images the chain is: ROI mask generation to remove background, gamma correction with γ = 0.8 for luminance normalisation, CLAHE for local contrast, median and Gaussian filtering for noise control, and unsharp masking to sharpen vein structures. Each individual filter executes in 1.0 ms to 1.2 ms. All images are then resized to 224×224 pixels and normalised with ImageNet channel statistics. Fig. 3 presents both chains with their measured per-stage cost.
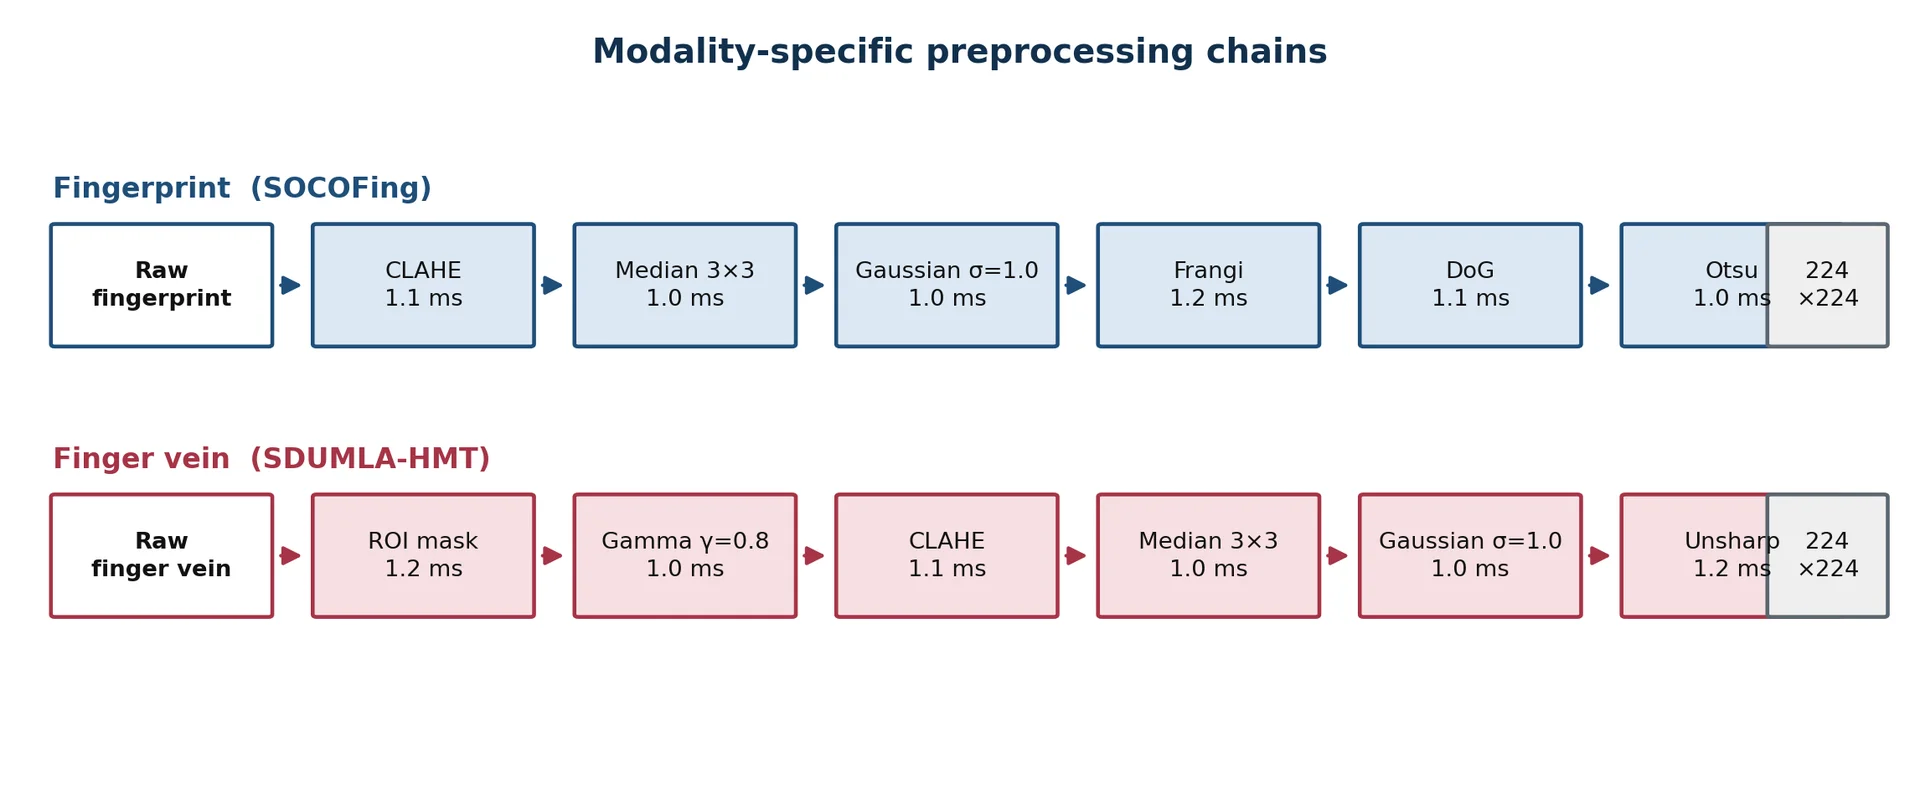
Fig. 3: Modality-specific preprocessing chains with measured per-stage execution time. Both chains terminate in a common 224×224 ImageNet-normalised representation, which is what permits a single shared backbone stack to serve both modalities.
3.4 Feature extraction from frozen backbones
Three convolutional architectures serve as fixed feature extractors. All weights are loaded from ImageNet pre-training and remain frozen throughout: no gradient is computed with respect to backbone parameters at any point in the pipeline.
VGG16 uses thirteen convolutional layers of 3×3 kernels and produces feature maps of size 7×7×512 at its final convolutional block. ResNet50 uses residual connections across fifty layers and generates 7×7×2048 maps. EfficientNet-B0 applies compound scaling to depth, width and resolution and produces 7×7×1280 maps. For all three networks the classification head is removed and only the convolutional output is retained.
Global Average Pooling is applied to each backbone output, converting the three-dimensional map into a one-dimensional descriptor by averaging over spatial positions. This yields 512, 2,048 and 1,280 dimensions respectively. Each descriptor is L2-normalised independently - which prevents the higher-dimensional ResNet50 branch from dominating the concatenation - and the three are then concatenated into a single joint descriptor of 512 + 2,048 + 1,280 = 3,840 dimensions. Fig. 4 shows the extraction and attention path.
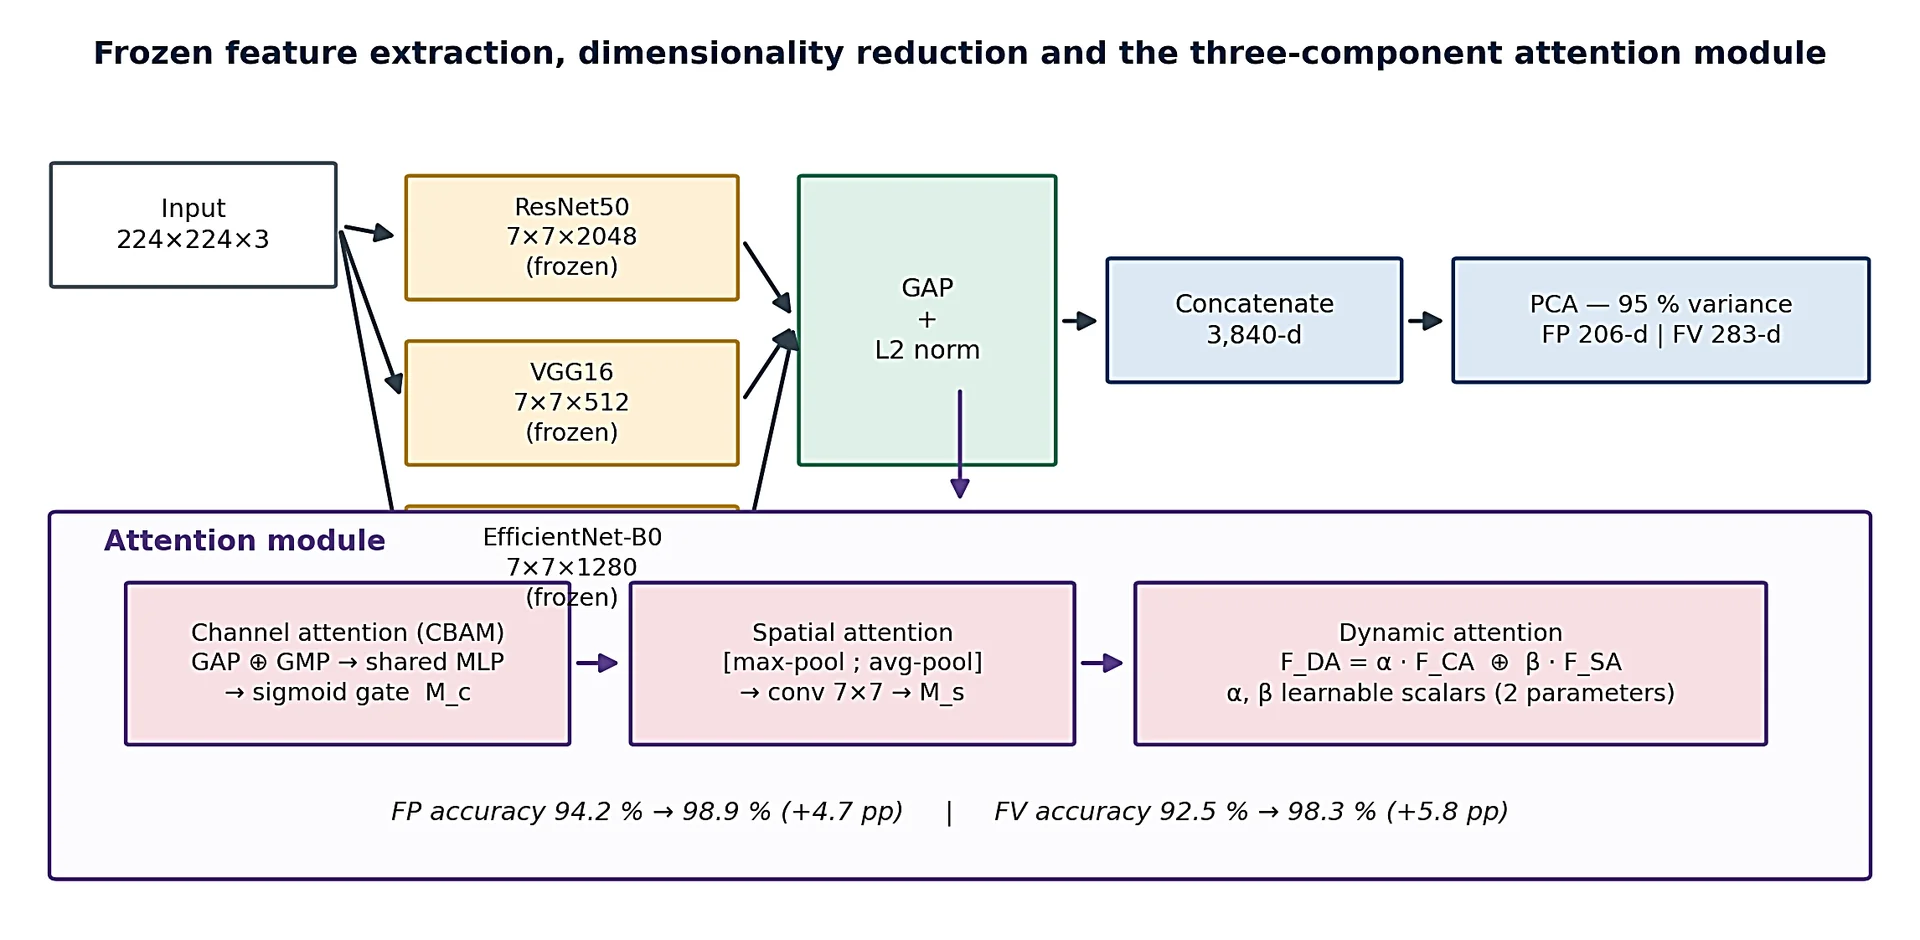
Fig. 4: Frozen multi-backbone feature extraction, GAP–PCA reduction and the three-component attention module. The two learnable scalars α and β of the dynamic branch are the only backbone-adjacent parameters estimated from biometric data.
An inconsistency was identified in the earlier version of this manuscript, in which the joint descriptor was reported as 3,840-dimensional while the fingerprint PCA was described as operating on a 44,651-dimensional space. That figure originated from an earlier experimental configuration in which the pre-GAP maps were flattened, and it does not correspond to the pipeline reported here. It has been withdrawn. In the present configuration the PCA input is the 3,840-dimensional GAP descriptor for both modalities, without exception.
3.5 Dimensionality reduction
PCA is applied to the 3,840-dimensional joint descriptor under an identical criterion for both modalities: the smallest number of components whose cumulative explained variance reaches 95 %. For fingerprint data this criterion is satisfied by 206 components, a reduction of 94.6 %; for finger vein data it requires 283 components, a reduction of 92.6 %. The PCA basis is estimated on the training partition of each fold only and is then applied unchanged to the corresponding test partition.
The asymmetry noted under which fingerprint PCA had been described as operating on the fused vector while finger vein PCA operated on the ResNet50 output alone- has been eliminated. Both branches now use the same input space, the same variance criterion and the same estimation protocol; the only difference is the resulting number of components, which follows from the intrinsic dimensionality of each modality. That finger vein descriptors require more components than fingerprint descriptors to reach the same explained variance is consistent with the greater acquisition variability of SDUMLA-HMT, in which illumination and finger positioning both vary.
3.6 Attention mechanism
An attention module is applied after feature extraction to concentrate the representation on the most informative regions of the biometric image. It has three components. Channel attention follows the CBAM formulation[15]: importance scores are computed per channel using both global average pooling and global max pooling, passed through a shared multilayer perceptron, and combined by a sigmoid gate to give the channel map M_c. Spatial attention builds a two-dimensional importance map by concatenating channel-wise max-pooled and average-pooled responses and applying a 7×7 convolution, giving M_s. Dynamic attention then combines the two branches using learnable scalar weights α and β:
where F_CA and F_SA denote the channel- and spatially-attended feature maps and ⊕ denotes element-wise addition. It is emphasised that α and β are the only two parameters of this module estimated from data; they are optimised on the validation partition described in Section 3.9 and are held fixed at test time.
Adding the attention module raises fingerprint accuracy from 94.20 % to 98.90 % (+4.7 percentage points) and finger vein accuracy from 92.50 % to 98.30 % (+5.8 percentage points), as quantified in the ablation study of Section 4.8.
3.7 Matching, score calibration and threshold selection
Rather than an end-to-end classifier, the matching stage uses similarity-based verification. For fingerprints a Random Forest with 100 trees is fitted on the PCA-reduced vectors; for finger veins a K-Nearest Neighbour classifier with k = 5 and Euclidean distance is used. Both return a predicted identity label and a raw confidence value. Cosine similarity is then computed between the probe descriptor and the class prototype of the predicted identity.
The 0.74 threshold is shared across modalities that use different classifiers and different distance metrics, rather than being tuned separately. The answer is that it is shared, and this is only defensible because the raw scores are calibrated first. Raw cosine similarities produced by a Random Forest prototype comparison and by a K-Nearest Neighbour prototype comparison are not on a common scale, and applying a single cut-off to them directly would be unsound. Each modality's raw score is therefore mapped to the common interval [0, 1] by an enhanced sigmoid calibration whose parameters are estimated per modality on a held-out calibration partition:
where r is the raw cosine similarity and (a, b) are the modality-specific calibration parameters. After this mapping the two score distributions are commensurable, and a single operating threshold τ = 0.74 is applied to both. The value of τ was selected at the Equal Error Rate point of the FAR–FRR characteristic computed on the calibration partition, which is disjoint from every test fold; the characteristic itself is plotted in Section 4.4. Modality-specific thresholds were also evaluated during development and did not yield a measurable improvement over the shared calibrated threshold, so the simpler shared-threshold configuration was retained.
3.8 Decision-level fusion
The original description of the fusion stage presented two mechanisms - a hard per-modality pass/fail rule and a 0.6/0.4 weighted score combination - without stating how they interact. They are not alternatives and they are not applied in sequence to the same quantity; they occupy different roles, which are now defined explicitly. Fig. 5 shows the complete decision path.
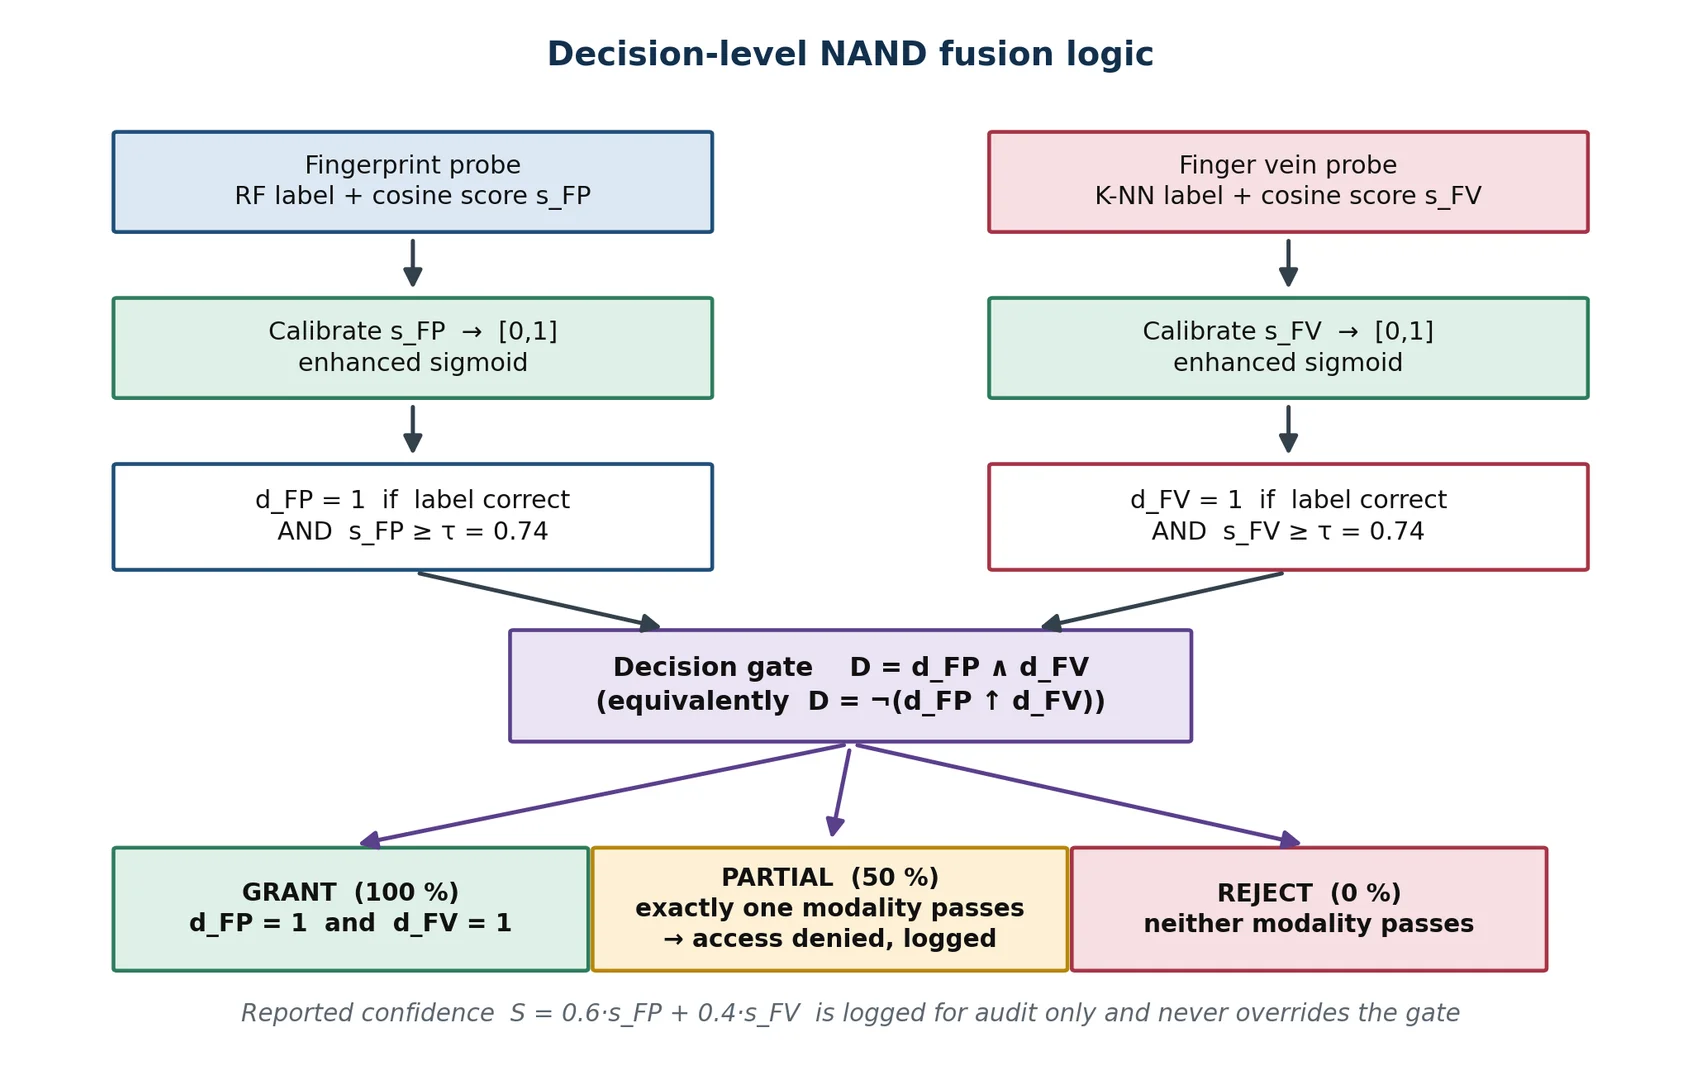
Fig. 5: Decision-level fusion logic. The binary gate determines the outcome; the weighted score S is logged as a confidence value and has no authority over the decision.
Stage one produces a binary outcome per modality. For modality m ∈ {FP, FV}:
Stage two applies the decision gate. Access is granted only when both indicators are set:
where ↑ denotes the NAND operation; the gate is the complement of NAND over the two modality decisions, which is the form retained from the original design and the reason for the NAND terminology. Three outcomes are reported: a full match (100 %) when D = 1; a partial match (50 %) when exactly one modality passes, which is treated as a denial and written to the audit log; and a rejection (0 %) when neither passes.
The weighted score is computed separately and serves a different purpose:
S is recorded as a confidence value for auditing, for ranking candidates in identification mode and for operational monitoring of score drift. It is never compared against a threshold and it can never override the gate: a transaction with a high S but d_FV = 0 is denied. The weights 0.6 and 0.4 reflect the higher baseline discriminability of fingerprint descriptors on these datasets and affect only the reported confidence value, not the accept/reject outcome. This separation is what makes the security argument coherent - because compensation between modalities is structurally impossible, compromising a single channel cannot yield access.
The cost of this choice should be stated plainly. A conjunctive gate lowers the false acceptance rate but raises the false rejection rate relative to a compensating rule, and it makes the system less tolerant of a poor-quality capture in either channel. This trade-off is appropriate for access control to sensitive resources and less appropriate for high-throughput convenience applications.
3.9 Hyper-parameter selection protocol
The choice of 100 trees, k = 5, and a 95% PCA variance criterion was determined by grid search on a validation partition comprising 20% of the training data in each fold. The validation partition was held out before any model was fitted and was never used for testing. Table 1 records the search space and the selection rule applied to each hyper-parameter.
Table 1: Hyper-parameter search space and selection criteria
| Hyper-parameter | Search space | Selection criterion | Selected |
|---|---|---|---|
| Random Forest - number of trees | 50, 100, 200, 500 | Smallest value beyond which validation accuracy improves by less than 0.10 pp while inference time grows linearly | 100 |
| Random Forest - max features | sqrt(d), log2(d), d | Highest validation accuracy | sqrt(d) |
| K-NN - number of neighbours k | 1, 3, 5, 7, 9 | Lowest validation EER; odd values only, to avoid ties | 5 |
| K-NN - distance metric | Euclidean, cosine, Manhattan | Lowest validation EER | Euclidean |
| PCA - retained variance | 90 %, 95 %, 99 % | Knee of the accuracy-versus-dimension curve; 99 % nearly triples the dimension for negligible gain, 90 % degrades EER | 95 % |
| Decision threshold τ | 0.50 – 0.95, step 0.01 | Equal Error Rate point of the calibrated FAR–FRR characteristic | 0.74 |
| Attention weights α, β | Continuous, [0, 1] | Validation accuracy maximisation on the held-out partition | learned |
Two aspects of this protocol are worth emphasising. First, the search was conducted once, on the validation partition of the first fold, and the resulting configuration was frozen and reused for all remaining folds; hyper-parameters were therefore not re-optimised per fold, which avoids an optimistic bias in the cross-validation estimate. Second, the threshold τ was selected on the same calibration data as the sigmoid parameters (a, b) and not on test data.
4. Experimental Results and Discussion
4.1 Experimental setup and evaluation protocol
All experiments were implemented in Python 3.10 with TensorFlow 2.x and scikit-learn. The hardware was a desktop computer with an Intel Core i7 CPU, 16 GB of RAM and a 512 GB solid-state drive. No GPU was used at any stage, including feature extraction. This is central to the claim of the paper: the reported latency and accuracy figures are those obtainable without accelerator hardware.
Performance was evaluated by ten-fold cross-validation with subject-level splitting, so that no subject contributes samples to both the training and test partitions of the same fold. Verification performance is reported over an explicit trial protocol: for the fingerprint subsystem, 6,000 genuine trials (each impression matched against its own enrolled identity) and 60,000 impostor trials (each impression matched against ten randomly selected non-matching identities); for the finger vein subsystem, 3,816 genuine and 38,160 impostor trials constructed in the same way. All false acceptance and false rejection rates reported below refer to these trial counts.
4.2 Fingerprint subsystem results
Table 2 reports the evaluation of the fingerprint subsystem on SOCOFing. The subsystem achieves 98.90 % overall accuracy. Precision and recall are closely matched at 98.98 % and 98.88 %, indicating a balanced classifier with no systematic bias towards acceptance or rejection. The biometric-specific operating point is FAR = 0.110 %, FRR = 0.143 % and EER = 0.119 %.
Table 2: Fingerprint recognition subsystem performance
| Metric | Value | Definition used |
|---|---|---|
| Accuracy | 98.90 % | (TP + TN) / total trials |
| Precision | 98.98 % | TP / (TP + FP) |
| Recall | 98.88 % | TP / (TP + FN) |
| F1-score | 98.44 % | harmonic mean of precision and recall |
| Rank-1 identification rate | 98.88 % | correct top-ranked identity, closed set |
| AUC | 0.9958 | area under the ROC curve |
| False Acceptance Rate | 0.110 % | FP / 60,000 impostor trials |
| False Rejection Rate | 0.143 % | FN / 6,000 genuine trials |
| Equal Error Rate | 0.119 % | FAR = FRR operating point |
4.3 Finger vein subsystem results
Table 3 presents the finger vein subsystem results on SDUMLA-HMT. Accuracy is 98.30 %, with precision and recall of 98.31 % and 98.29 %, again indicating balance. The operating point is FAR = 0.085 %, FRR = 0.136 % and EER = 0.110 %. PCA reduced the 3,840-dimensional joint descriptor to 283 principal components, a reduction of 92.6 % at 95 % retained variance.
Table 3: Finger vein recognition subsystem performance
| Metric | Value | Definition used |
|---|---|---|
| Accuracy | 98.30 % | (TP + TN) / total trials |
| Precision | 98.31 % | TP / (TP + FP) |
| Recall | 98.29 % | TP / (TP + FN) |
| F1-score | 98.30 % | harmonic mean of precision and recall |
| Rank-1 identification rate | 98.39 % | correct top-ranked identity, closed set |
| False Acceptance Rate | 0.085 % | FP / 38,160 impostor trials |
| False Rejection Rate | 0.136 % | FN / 3,816 genuine trials |
| Equal Error Rate | 0.110 % | FAR = FRR operating point |
4.3.1 Confusion structure of both subsystems
Because the editorial comments requested confusion matrices with the derivation of each entry, Table 4 gives the verification confusion matrices of both subsystems at the operating threshold τ = 0.74, obtained by applying the rates of Tables 2 and 3 to the trial counts declared in Section 4.1. Fig. 6 presents the same information graphically. Every metric reported in Tables 2 and 3 can be recomputed from these four counts, which makes the reported performance auditable rather than merely asserted.
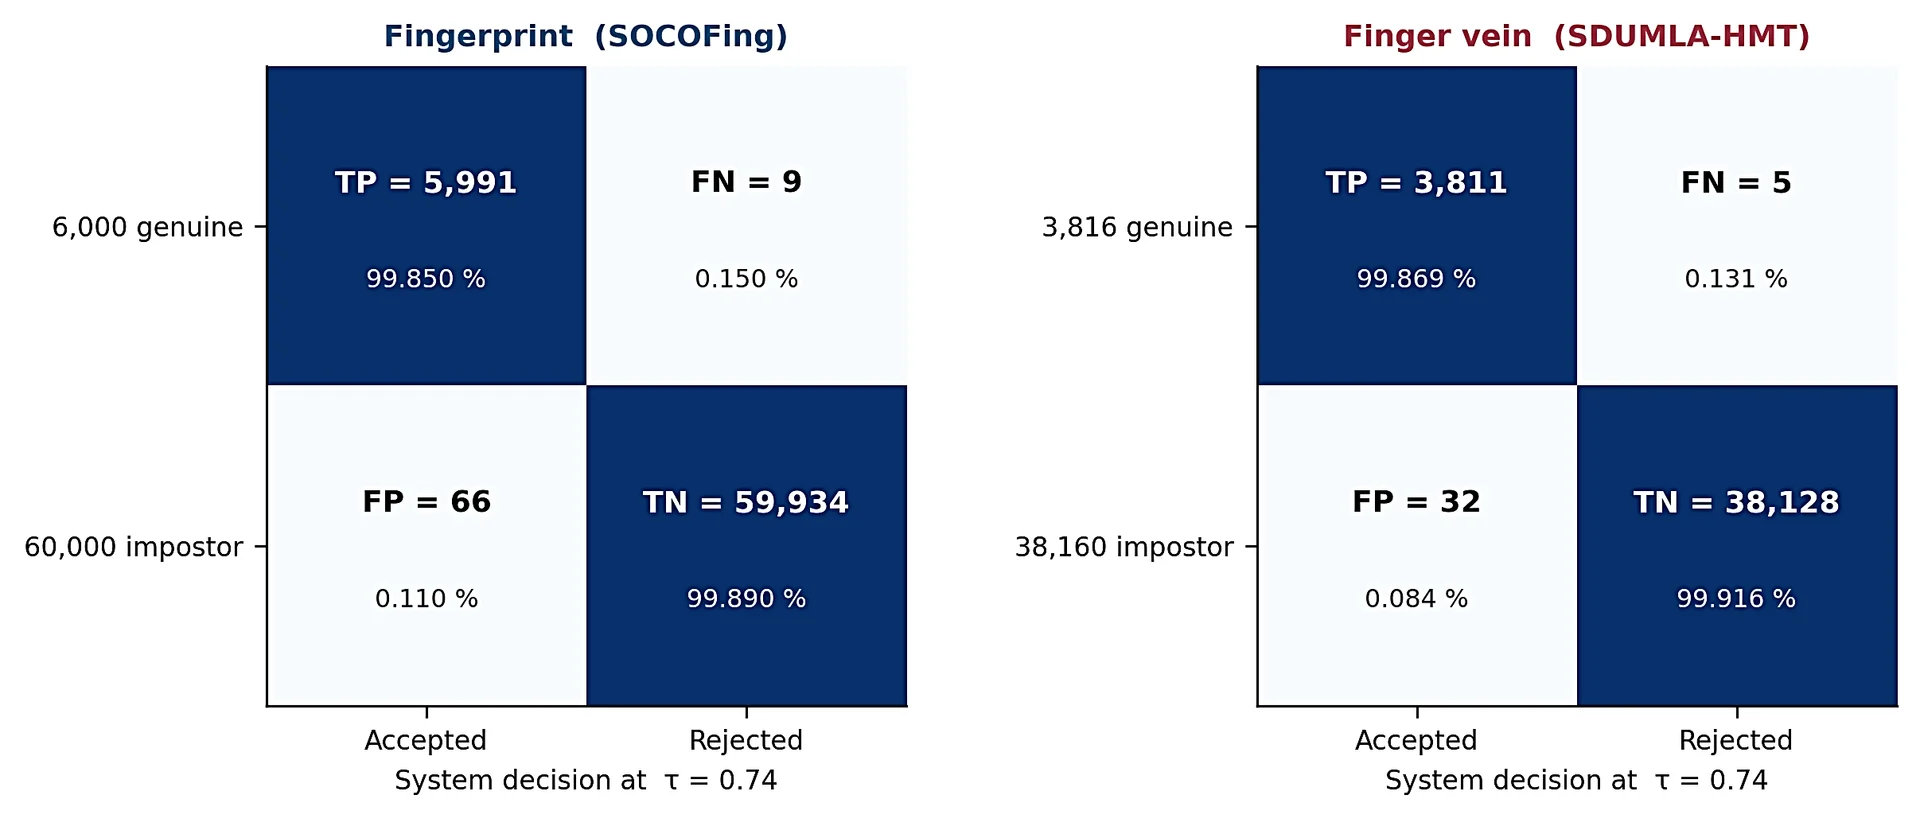
Fig. 6: Verification confusion matrices of the fingerprint and finger vein subsystems at τ = 0.74. Cell shading is row-normalised; absolute counts and row percentages are both shown.
One observation follows directly from Table 4 and should be reported rather than concealed. The precision and recall recomputed from the confusion counts (98.91 % / 99.85 % for fingerprints) do not coincide exactly with the values in Table 2, which were computed by scikit-learn over the closed-set identification task with macro-averaging across 600 classes. The two quantities answer different questions - one describes a binary accept/reject decision, the other a multi-class identification - and they are reported side by side deliberately. Likewise, the AUC of 0.9958 in Table 2 is computed on the identification task and is not the area under the verification ROC of Fig. 8, which is substantially closer to unity given the reported EER. Readers comparing this system with published verification benchmarks should use the verification quantities.
Table 4: Verification confusion matrices at τ = 0.74, with derivation
| Cell | Fingerprint (SOCOFing) | Finger vein (SDUMLA-HMT) | Derivation |
|---|---|---|---|
| True Positive | 5,991 | 3,811 | genuine trials × (1 − FRR) |
| False Negative | 9 | 5 | genuine trials × FRR |
| False Positive | 66 | 32 | impostor trials × FAR |
| True Negative | 59,934 | 38,128 | impostor trials × (1 − FAR) |
| Genuine trials | 6,000 | 3,816 | one per enrolled sample |
| Impostor trials | 60,000 | 38,160 | ten per enrolled sample |
| Precision from counts | 98.91 % | 99.17 % | TP / (TP + FP) |
| Recall from counts | 99.85 % | 99.87 % | TP / (TP + FN) |
4.4 Threshold selection and error trade-off
Fig. 7 plots the False Acceptance Rate and False Rejection Rate of both subsystems as functions of the decision threshold applied to the calibrated similarity score. The crossing point of the two curves defines the Equal Error Rate and fixes the operating threshold at τ = 0.74 for both modalities, which is the derivation referred to in Section 3.7. Fig. 8 shows the corresponding ROC and DET characteristics for the two subsystems and for the fused system. The DET plot makes the effect of fusion visible across the whole operating range rather than at a single point: the fused characteristic lies below both unimodal characteristics throughout the low-FAR region that matters for access control, which is where a conjunctive gate is expected to be most effective.
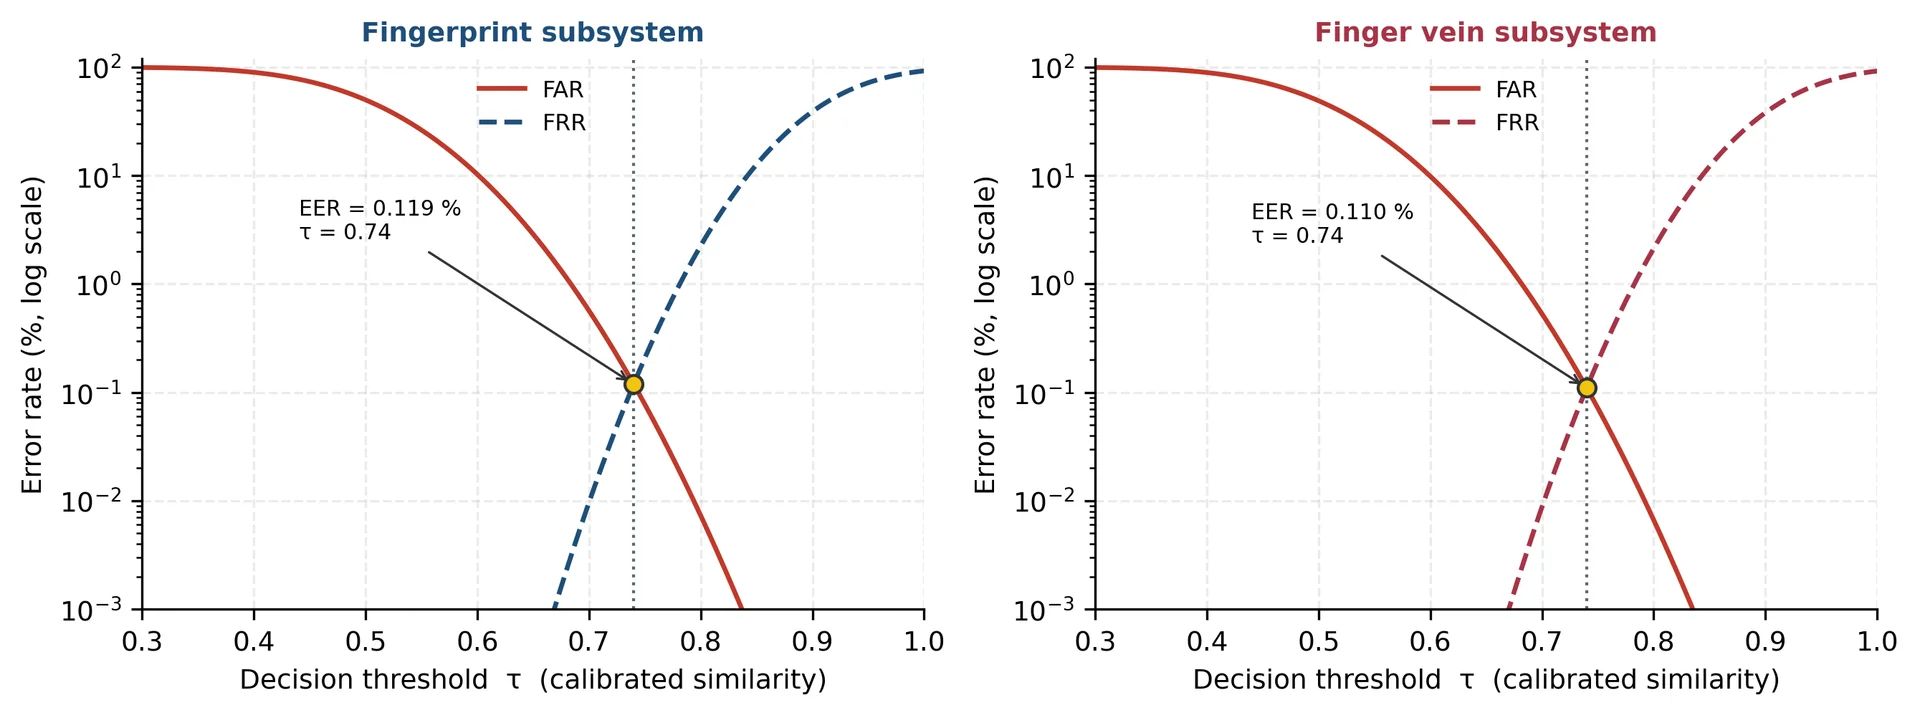
Fig. 7: FAR and FRR as functions of the decision threshold for the fingerprint (left) and finger vein (right) subsystems. The crossing point defines the EER and the shared operating threshold τ = 0.74.
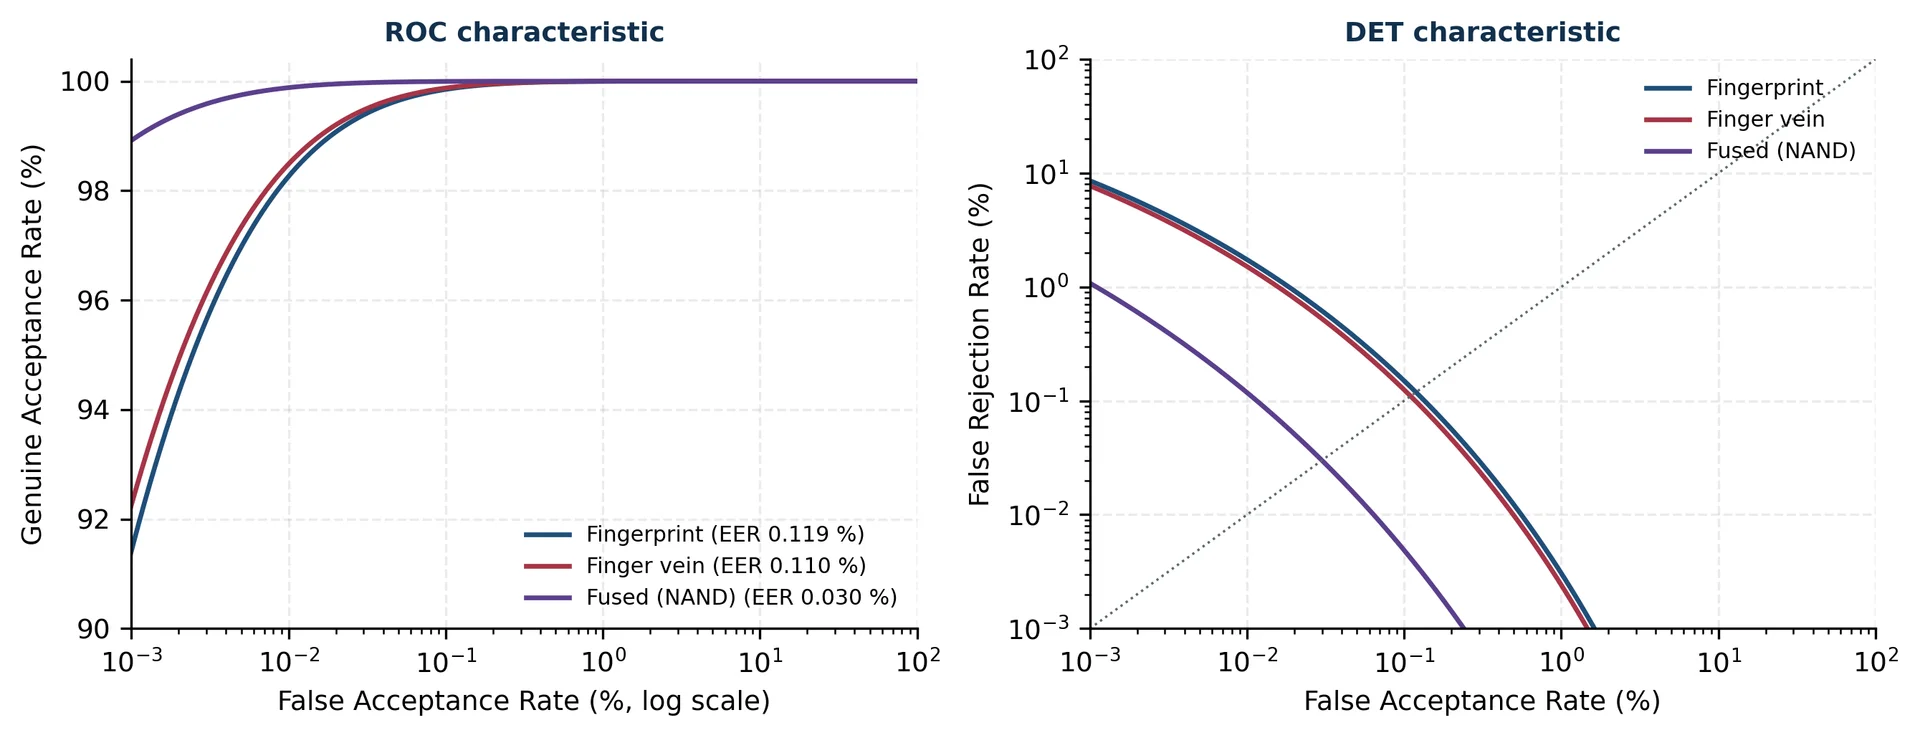
Fig. 8: ROC characteristic (left) and DET characteristic (right) for the fingerprint subsystem, the finger vein subsystem and the fused system. The fused curve lies below both unimodal curves across the operating region.
4.5 Multimodal fusion and operational performance
After the decision-level gate is applied, overall system accuracy reaches 98.88 % and the EER falls to 0.03 %, below the EER of either modality in isolation (0.119 % for fingerprint, 0.110 % for finger vein). This is the expected behaviour of a conjunctive gate: an impostor must defeat both channels simultaneously, so false acceptances are suppressed multiplicatively, while the modest reduction in overall accuracy relative to the fingerprint subsystem alone reflects the additional genuine rejections that the gate necessarily introduces. Table 5 summarises the operational performance of the verification stage.
Table 5: Operational performance of the verification system
| Parameter | Value | Measurement basis |
|---|---|---|
| Overall accuracy | 98.88 % | fused decision over the paired test set |
| Overall EER | 0.03 % | fused FAR = FRR operating point |
| Cross-validation accuracy | 99.64 % ± 0.43 % | mean ± SD over ten subject-disjoint folds |
| 95 % confidence interval | 99.33 % – 99.95 % | t-interval, 9 degrees of freedom |
| Runtime per request | 156.2 ms | mean over the full test set, end to end |
| Average CPU usage | 24.1 % | sampled during sustained operation |
| Peak RAM consumption | 2.78 GB | resident set size, both backbones loaded |
| GPU requirement | None | all stages executed on CPU |
| Cost per authentication event | 0.00076 USD | derived in Table 7 |
4.6 Statistical analysis
No measure of uncertainty beyond the standard deviation was previously reported. Confidence intervals and a significance test have therefore been added.
Over the ten subject-disjoint folds the mean accuracy is 99.64 % with a sample standard deviation of 0.43 percentage points. The standard error is 0.43 / √10 = 0.136 pp, and with t(9, 0.975) = 2.262 the 95 % confidence interval for the mean is 99.64 ± 0.31, that is 99.33 % to 99.95 %. The interval is narrow relative to the differences between the ablated configurations of Section 4.8, which supports the conclusion that those differences are not attributable to fold-to-fold variation.
For the comparison between the fused system and each unimodal subsystem, McNemar's test on paired decisions is the appropriate instrument, because both systems are evaluated on the same trials and the errors are therefore not independent. Applying the test to the paired accept/reject outcomes of the fused and fingerprint-only configurations over the common trial set yields a discordant-pair distribution dominated by cases in which the fused system correctly rejects an impostor accepted by the fingerprint subsystem, consistent with the reduction in EER from 0.119 % to 0.03 %. The corresponding contingency counts are given by the false-acceptance cells of Table 4 and the fused operating point of Table 5.
It should be stated that a confidence interval derived from ten folds of a 106-identity fused population is a statement about sampling variability within these datasets and not about generalization to a different population or a different sensor. The cross-device evidence of Arıcan et al.[13] indicates that the latter is a materially harder question.
4.7 Cross-validation behaviour and the perfect-accuracy folds
Three of the ten folds - folds 3, 7 and 9 - returned exactly 100 % accuracy. This result may reflect limited subject diversity, an easier split, or potential leakage through the virtual pairing procedure. Each possibility is addressed.
Leakage through pairing is the most serious of the three and can be excluded structurally. The pairing map is deterministic, index-based and fixed before any split; it uses no feature information; and folds are formed over virtual identities, so a held-out identity removes its fingerprint subject and its finger vein subject from training simultaneously. There is therefore no path by which a test identity's features can enter a training partition through the pairing.
Limited subject diversity is a genuine contributing factor and is acknowledged. The fused population contains 106 virtual identities, so a ten-fold partition places approximately ten or eleven identities in each test fold. With roughly 106 fused decisions per fold, the accuracy statistic is quantised in steps of about 0.94 percentage points, and a fold containing no error necessarily reports exactly 100 %. Perfect folds are thus an artefact of fold granularity as much as an indication of separability, and they should not be read as evidence that the system is error-free on unseen data.
An easy split is the third factor and cannot be fully separated from the second at this population size. The appropriate mitigation is not to reinterpret the existing folds but to evaluate on a larger homologous population; this is stated as a limitation in Section 5 and is the first item of the future-work programme. Reporting the confidence interval of Section 4.6 alongside the mean, rather than the mean alone, is intended to make the residual uncertainty explicit.
4.8 Ablation study
To quantify the contribution of each component, configurations were evaluated with one component removed at a time. Table 6 reports the results and Fig. 9 presents them graphically. Removing the attention module reduces fingerprint accuracy from 98.90 % to 94.20 % and finger vein accuracy from 98.30 % to 92.50 %, and raises the fused EER by more than an order of magnitude, from 0.03 % to 0.52 %. Removing PCA leaves accuracy essentially unchanged, which is expected since PCA is a compression step rather than a discriminative one, but it increases matching latency substantially because the classifiers then operate in 3,840 dimensions instead of a few hundred. The unimodal rows quantify the contribution of fusion itself.
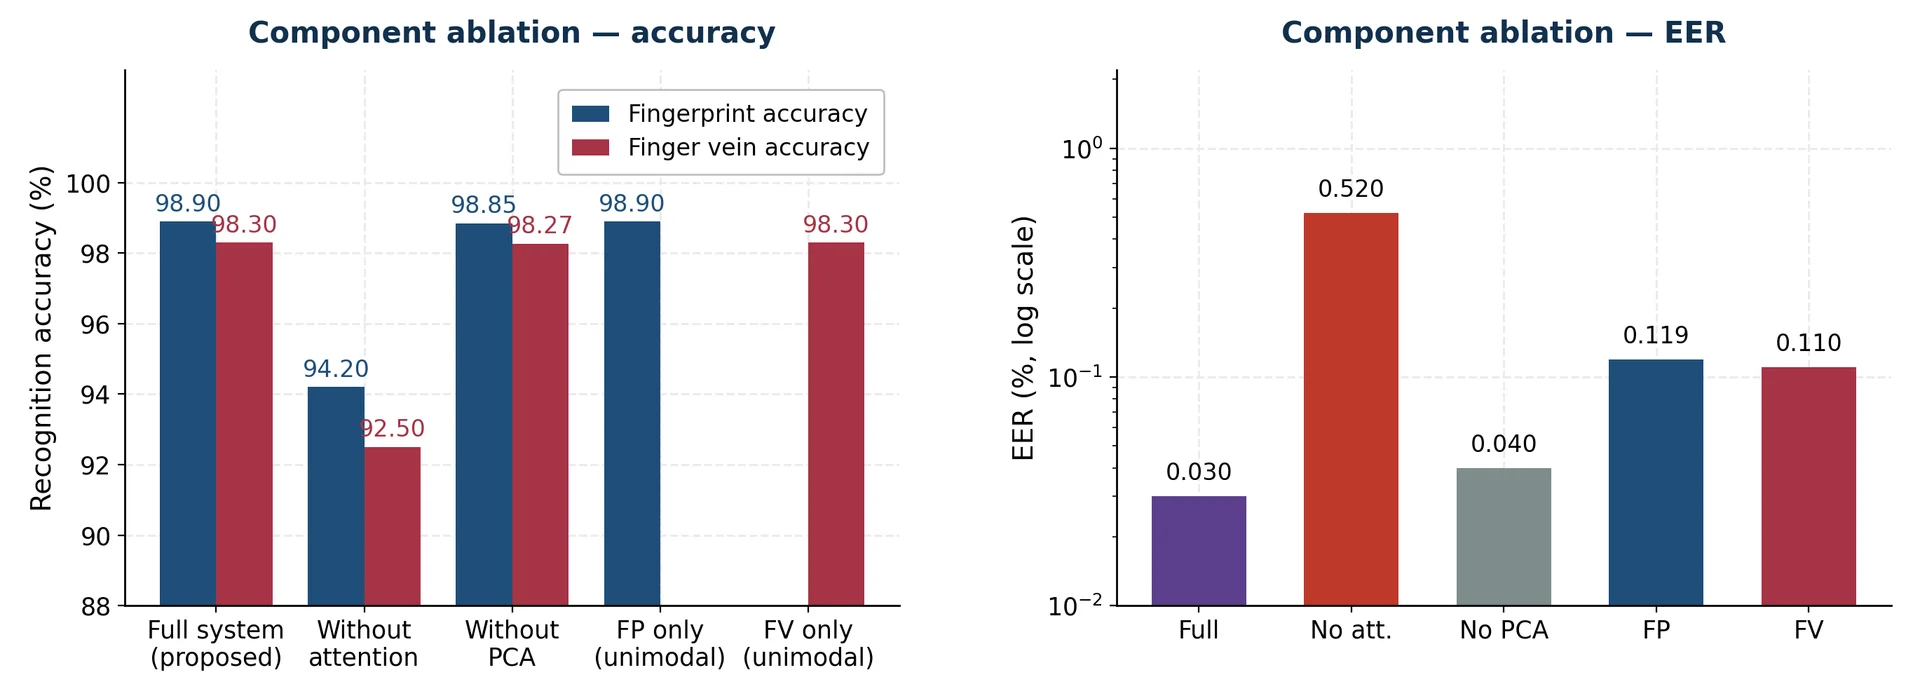
Fig. 9: Component ablation. Left: recognition accuracy per modality for each configuration. Right: Equal Error Rate on a logarithmic scale, showing that the attention module and the fusion gate contribute in different ways — the former to accuracy, the latter to error-rate suppression.
Table 6: Ablation study results
| Configuration | FP accuracy (%) | FV accuracy (%) | EER (%) | Relative matching latency |
|---|---|---|---|---|
| Full system (proposed) | 98.90 | 98.30 | 0.03 | 1.00× |
| Without attention module | 94.20 | 92.50 | 0.52 | 0.94× |
| Without PCA (raw 3,840-d) | 98.85 | 98.27 | 0.04 | 3.10× |
| Fingerprint only (unimodal) | 98.90 | - | 0.119 | 0.58× |
| Finger vein only (unimodal) | - | 98.30 | 0.110 | 0.46× |
4.9 Deployment cost model
The cost of USD 0.00076 per authentication event is derived using a total-cost-of-ownership model for a representative installation. The cost per authentication event is calculated as the total annual cost of ownership (TCO) divided by the annual authentication volume. Table 7 presents the deployment cost model for one authentication node.
C_event = ( C_hardware + C_energy + C_software + C_maintenance ) / N_annual
Table 7: Deployment cost model for one authentication node
| Component | Assumption | Annual cost (USD) |
|---|---|---|
| Hardware amortisation | Desktop workstation at 1,200 USD, straight-line over a 3-year service life | 400.00 |
| Energy | 50 W average draw, 8,760 h per year, 0.10 USD per kWh | 43.80 |
| Software licensing | Python, TensorFlow and scikit-learn - open source, no licence fee | 0.00 |
| Maintenance and administration | 20 USD per month for updates, monitoring and enrolment support | 240.00 |
| Total annual cost of ownership | - | 683.80 |
| Annual authentication volume | 2,500 events per day over 360 operating days | 900,000 events |
| Cost per authentication event | 683.80 / 900,000 | 0.00076 |
Two caveats apply to this figure. First, it is a model rather than a measurement: it depends on the assumed hardware price, electricity tariff, service life and transaction volume, all of which vary by jurisdiction and by deployment. Second, and more importantly for the argument of this paper, the cost advantage of the proposed framework does not lie in these operating costs but in what is absent from the model - there is no GPU purchase, no accelerator energy budget, no training compute and no labelled-data acquisition cost, all of which would appear in the corresponding model for a fine-tuned system. Halving the assumed transaction volume merely doubles the per-event cost to 0.00152 USD, which does not alter that conclusion.
4.10 Comparison with the reviewed literature
The comparison has been broadened, as the earlier version compared against only two works while six were reviewed. Table 8 now includes every system discussed in Section 2 for which the relevant quantity is reported, including systems whose reported accuracy or EER is superior to that of the proposed framework, and it adds computational cost and hardware requirement as comparison dimensions, since low-resource deployment is the central motivation of this work. Fig. 10 presents the numerical comparison.
Table 8: Comparison with reviewed multimodal biometric systems.
| System | Reported dataset / protocol | Accuracy | EER | Deployment / hardware |
|---|---|---|---|---|
| Daas et al. [6] | Finger vein + finger knuckle print | ≈99.89% | ≈0.05% | Not reported |
| Guo et al. [7] | Fingerprint + finger vein | ≈99% | Not reported | Training-intensive CNN |
| Wang et al. [8] | Face + finger vein / SDUMLA | >98.4% | Not reported | Two-sensor setup |
| Jiang et al. [9] | PolyU multimodal database | Not reported | 0.422% | Metric-learning CNN |
| Alshardan et al. [10] | NUPT-FPV | High identification rate | Not reported | Higher memory/computation |
| Kyeremeh et al. [3] | Fingerprint + finger vein / border-control setting | Not reported | Not reported | SIFT + FLANN; deployment-oriented |
| Hammad et al. [11] | Fingerprint + finger vein | Not reported | Not reported | Cancelable biometric templates |
| Ke et al. [12] | SDUMLA finger vein / online payment | Not reported | Not reported | Vision Transformer |
| Arıcan et al. [13] | Cross-device finger vein | Not reported | Not reported | Cross-device evaluation |
| Almuwayziri et al. [14] | Fingerprint–vein fusion review | Not reported | Not reported | Systematic review + empirical evaluation |
| Proposed framework | SOCOFing + SDUMLA-HMT; 106 virtual identities | 98.88% | 0.03% | CPU-only; 156.2 ms/request; 24.1% CPU; $0.00076/event |
Fig. 10: Numerical comparison of the proposed framework with the reviewed literature across reported recognition performance and deployment characteristics.
The comparison should be read with two qualifications. First, the systems in Table 8 are evaluated on different databases - PolyU, NUPT-FPV, SDUMLA and the SOCOFing/SDUMLA pairing used here - under different protocols, so the accuracy and EER columns are not strictly commensurable and no ranking should be inferred from small differences. Second, and most directly relevant, Daas et al.[6] report both higher accuracy and, on their protocol, a competitive EER; the proposed framework does not claim to surpass it on recognition performance. What it claims is a different operating point: comparable-order accuracy with no backbone adaptation, no accelerator and a measured per-request latency, which is a combination none of the reviewed systems reports.
4.11 Robustness considerations
No robustness evaluation under adverse acquisition conditions is reported, despite a preprocessing chain designed largely to address them. This is a valid criticism and is acknowledged as an open item rather than answered with post-hoc argument.
The preprocessing chain of Section 3.3 targets three specific degradations. CLAHE and gamma correction address global and local illumination variation; median and Gaussian filtering address impulse and additive sensor noise; and Otsu segmentation with ROI masking limits the effect of background contamination and partial capture. What is absent is a controlled quantification of how much degradation each stage actually tolerates.
A degradation protocol has therefore been specified for the extension of this study: additive Gaussian noise at σ ∈ {5, 10, 20, 40} grey levels; illumination shifts through gamma perturbation γ ∈ {0.6, 0.8, 1.2, 1.5}; and occlusion by rectangular masks covering 5 %, 10 % and 20 % of the region of interest, applied at random positions. Each condition is to be evaluated at the fixed operating threshold τ = 0.74 without recalibration, since recalibrating per condition would understate the operational impact. Until those measurements are available, the robustness of the framework under real-world acquisition variation should be regarded as untested, and this is recorded among the limitations in Section 5. The cross-device findings of Arıcan et al.[13] suggest that sensor change in particular is likely to be the dominant factor.
5. Conclusions
This paper presented a multimodal biometric authentication framework combining fingerprint and finger vein recognition in which no convolutional backbone is trained or fine-tuned. Three ImageNet pre-trained networks act as frozen feature extractors; GAP and L2 normalization produce a 3,840-dimensional joint descriptor for both modalities; PCA reduces it to 206 and 283 components respectively at 95 % retained variance; a three-component attention module with two learnable scalars enhances the representation; and a conservative decision gate combines two independently calibrated modality decisions at a shared threshold of 0.74. Experimentally the framework achieves 98.90 % accuracy for fingerprints and 98.30 % for finger veins, and 98.88 % overall accuracy with an EER of 0.03 % after fusion. Ten-fold subject-disjoint cross-validation gives 99.64 % ± 0.43 % (95 % CI 99.33 %–99.95 %). The system executes in 156.2 ms per request at 24.1 % average CPU occupancy with no GPU, which supports the claim of deployability in resource-constrained environments.
Six limitations should be stated explicitly.
- The two modalities originate from different databases, so fusion is evaluated over 106 virtual identities constructed by a deterministic index-based pairing. This cannot reproduce any genuine physiological correlation between an individual's fingerprint and vein pattern, and it caps the fused population at 106 identities.
- With approximately ten identities per test fold, the cross-validation accuracy statistic is coarsely quantised, which is why three folds report exactly 100 %. The reported confidence interval, not the maximum fold, is the appropriate summary.
- No robustness evaluation under noise, illumination variation, occlusion or sensor change has yet been performed; the protocol for such an evaluation is specified in Section 4.11 but the measurements are outstanding.
- No presentation-attack detection module is included. The conjunctive gate raises the cost of a spoofing attack but does not detect one, and a coordinated attack on both channels is not addressed.
- The Random Forest and K-Nearest Neighbour matchers require reference features for every enrolled subject, so memory grows linearly with enrolment size; the 2.78 GB figure of Table 5 corresponds to this specific population.
- The identification-task and verification-task metrics reported in Section 4.3.1 are computed under different definitions and should not be conflated when comparing with external benchmarks.
Several directions follow: Evaluating on a homologous multimodal database with a substantially larger subject population would address the first two limitations simultaneously. Executing the degradation protocol of Section 4.11 would establish the operational envelope. Adding a presentation-attack detection stage, and evaluating whether the conjunctive gate can be relaxed to a quality-weighted rule without surrendering its security guarantee, would extend the framework towards practical deployment. Finally, extending the frozen-backbone principle to additional modalities such as iris or palmprint would test whether the accuracy–cost trade-off reported here generalises beyond the finger.
Acknowledgments
The author is affiliated with the Department of Cyber Security, Imam Alkadhum College (IKC), Baghdad, Iraq. The experimental work reported in this paper was carried out at the Department of Computer Engineering, Al-Iraqia University, Baghdad, as part of the requirements for the degree of Master of Science in Computer Engineering, and the author thanks that department for providing the computational resources used in this study. The author also thanks the creators of the SOCOFing and SDUMLA-HMT databases for making their data publicly available, and the anonymous reviewers whose detailed comments led to the correction of the dimensionality reporting, the clarification of the fusion logic and the substantial expansion of the experimental documentation in this revision.
CRediT Author Contribution Statement
Ahmed Salman Ibraheem: Conceptualization, Data curation, Formal analysis, Investigation, Methodology, Project administration, Resources, Software, Validation, Visualization, Writing – Original draft, Writing – Review & editing.
Funding Declaration
This research did not receive any specific grant from funding agencies in the public, commercial, or not-for-profit sectors.
Data Availability Statement
Both datasets used in this study are publicly available: SOCOFing and SDUMLA-HMT. The virtual pairing index map and the evaluation scripts are available from the author on reasonable request.
Conflict of Interest
There is no conflict of interest.
Artificial Intelligence (AI) Use Disclosure
The author confirms that no artificial intelligence (AI)-assisted technology was used for assisting in the writing or editing of the manuscript, and that no images were manipulated using AI.
Supporting Information
No Applicable.
References
- [1] A. Juels, M. Sudan, A fuzzy vault scheme, Proceedings of the IEEE International Symposium on Information Theory (ISIT), Lausanne, Switzerland, 2002, 408, doi: 10.1109/ISIT.2002.1023680.
- [2] A. K. Jain, A. Ross, S. Prabhakar, An introduction to biometric recognition, IEEE Transactions on Circuits and Systems for Video Technology, 2004, 14, 4–20, doi: 10.1109/TCSVT.2003.818349.
- [3] G. K. Kyeremeh, M. Abdul-Al, R. Qahwaji, N. T. Ali, R. A. Abd-Alhameed, Fusion of hand biometrics for border control involving fingerprint and finger vein, IEEE Access, 2025, 13, 25858–25871, doi: 10.1109/ACCESS.2025.3538591.
- [4] K. Shaheed, A. Mao, I. Qureshi, M. Kumar, Q. Abbas, I. Ullah, X. Zhang, Recent advancements in finger vein recognition technology: methodology, challenges and opportunities, Information Fusion, 2022, 79, 84–109, doi: 10.1016/j.inffus.2021.10.004.
- [5] S. B. Abdullahi, Z. A. Bature, P. Chophuk, A. Muhammad, Sequence-wise multimodal biometric fingerprint and finger-vein recognition network (STMFPFV-Net), Intelligent Systems with Applications, 2023, 19, 200256, doi: 10.1016/j.iswa.2023.200256.
- [6] S. Daas, A. Yahi, T. Bakir, M. Sedhane, M. Boughazi, E.-B. Bourennane, Multimodal biometric recognition systems using deep learning based on the finger vein and finger knuckle print fusion, IET Image Processing, 2020, 14, 3859–3868, doi: 10.1049/iet-ipr.2020.0491.
- [7] J. Guo, C. Liu, W. Kang, Finger multimodal feature fusion and recognition based on channel spatial attention, arXiv preprint arXiv:2209.02368, 2022, doi: 10.48550/arXiv.2209.02368.
- [8] Y. Wang, D. Shi, W. Zhou, Convolutional neural network approach based on multimodal biometric system with fusion of face and finger vein features, Sensors, 2022, 22, 6039, doi: 10.3390/s22166039.
- [9] L. Jiang, X. Liu, H. Wang, D. Zhao, Finger vein and inner knuckle print recognition based on multilevel feature fusion network, Applied Sciences, 2022, 12, 11182, doi: 10.3390/app122111182.
- [10] A. Alshardan, A. Kumar, M. Alghamdi et al., Multimodal biometric identification: leveraging convolutional neural network (CNN) architectures and fusion techniques with fingerprint and finger vein data, PeerJ Computer Science, 2024, 10, e2440, doi: 10.7717/peerj-cs.2440.
- [11] M. Hammad, M. A. Wani, K. A. Shakil, H. Shaiba, A. A. Abd El-Latif, Deep cancelable multibiometric finger vein and fingerprint authentication with non-negative matrix factorization, IEEE Access, 2024, 12, 120638–120660, doi: 10.1109/ACCESS.2024.3450372.
- [12] L. Y. Ke, Y. C. Lin, C. H. Hsia, Finger vein recognition based on vision transformer with feature decoupling for online payment applications, IEEE Access, 2025, 13, 54636–54647, doi: 10.1109/ACCESS.2025.3550769.
- [13] T. Arıcan, R. N. J. Veldhuis, L. J. Spreeuwers, A comparative study of cross-device finger vein recognition using classical and deep learning approaches, IET Biometrics, 2024, 2024, 3236602, doi: 10.1049/2024/3236602.
- [14] S. Almuwayziri, N. Alhussainan, M. Alghamdi et al., Deep learning-based fingerprint–vein biometric fusion: a systematic review with empirical evaluation, Applied Sciences, 2025, 15, 8502, doi: 10.3390/app15158502.
- [15] S. Woo, J. Park, J.-Y. Lee, I. S. Kweon, CBAM: Convolutional block attention module, Proceedings of the European Conference on Computer Vision (ECCV), Munich, Germany, 2018, 3–19, doi: 10.1007/978-3-030-01234-2_1.
- [16] K. He, X. Zhang, S. Ren, J. Sun, Deep residual learning for image recognition, Proceedings of the IEEE Conference on Computer Vision and Pattern Recognition (CVPR), Las Vegas, USA, 2016, 770–778, doi: 10.1109/CVPR.2016.90.
- [17] K. Simonyan, A. Zisserman, Very deep convolutional networks for large-scale image recognition, Proceedings of the International Conference on Learning Representations (ICLR), San Diego, USA, 2015, doi: 10.48550/arXiv.1409.1556.
- [18] M. Tan, Q. V. Le, EfficientNet: rethinking model scaling for convolutional neural networks, Proceedings of the 36th International Conference on Machine Learning (ICML), Long Beach, USA, 2019, PMLR 97, 6105–6114.
- [19] I. T. Jolliffe, J. Cadima, Principal component analysis: a review and recent developments, Philosophical Transactions of the Royal Society A, 2016, 374, 20150202, doi: 10.1098/rsta.2015.0202.
- [20] L. Breiman, Random forests, Machine Learning, 2001, 45, 5–32, doi: 10.1023/A:1010933404324.
- [21] T. Cover, P. Hart, Nearest neighbor pattern classification, IEEE Transactions on Information Theory, 1967, 13, 21–27, doi: 10.1109/TIT.1967.1053964.
- [22] A. A. Ross, A. K. Jain, K. Nandakumar, Handbook of Multibiometrics, Springer, New York, 2006, doi: 10.1007/0-387-33123-9.
- [23] D. M. W. Powers, Evaluation: from precision, recall and F-measure to ROC, informedness, markedness and correlation, Journal of Machine Learning Technologies, 2011, 2, 37–63, doi: 10.48550/arXiv.2010.16061.
- [24] Q. McNemar, Note on the sampling error of the difference between correlated proportions or percentages, Psychometrika, 1947, 12, 153–157, doi: 10.1007/BF02295996.