

 Open Access||Research Article
Building a Knowledge Verification System Using AI
1 Department of Computer and Software Engineering, L.N. Gumilyov Eurasian National University, Astana, 010000, Kazakhstan
2 Department of Software, Akhmet Baitursynuly Kostanay Regional University, Kostanay, 110000, Kazakhstan
Abstract
A persistent problem in database education is that conventional learning management systems and simple SQL autograders usually verify whether an answer is correct but do not diagnose the underlying subtopic-level misconception or provide transparent remediation guidance. This paper presents an intelligent SQL learning support system that integrates an educational ER schema, validator-based error typing, L1–L6 markup, explainable CART diagnostics, and a pilot multidimensional item-response modeling layer. The anonymized pilot dataset contained 60 students, 30 SQL/database tasks, and 2,105 labeled attempts. Expert annotation showed high agreement (Cohen's kappa = 0.833). Learning outcomes improved in both groups, but compared with the control group, the experimental group using adaptive AI feedback improved more strongly: +17.80 percentage points versus +3.79 percentage points. The gain difference was 14.01 percentage points (Welch t(47.30) = 13.86, p < 0.001, 95% CI [11.98; 16.05], Hedges g = 3.53). For error classification, CART achieved an accuracy of 0.779, macro-F1 = 0.689, weighted-F1 = 0.793, and log-loss = 0.618 on the held-out test set (n = 317). Random forest and gradient boosting produced higher predictive scores, but CART was retained as the primary diagnostic model because of its interpretability. The MIRT layer was calibrated on a 60 × 30 item-response matrix and a six-dimensional Q-matrix. The results support the feasibility of explainable SQL diagnostics while indicating that broader cross-institutional validation is required before generalization.
Keywords
Graphical Abstract
Novelty Statement
The contribution of this study is an explainable and statistically validated SQL system that links ER-schema-aware validators, expert-labelled error taxonomy, CART-based diagnostic rules, and a pilot MIRT/Q-matrix layer for adaptive feedback and competency modelling.
1. Introduction
Artificial intelligence (AI) is being increasingly used in education to personalize learning, automate feedback, and support data-driven assessment. In database education, however, many digital learning environments still provide only binary correctness checking for SQL answers. They can mark a query as correct or incorrect, but they often do not explain whether the error concerns schema interpretation, JOIN logic, aggregation, keys and constraints, normalization, or terminology.
Object-relational databases were selected as the application domain because SQL and relational modeling are foundational competencies for software engineering, information systems, data analytics, cybersecurity, and interdisciplinary IT programs. Students must learn schema design, normalization, constraints, joins, grouping, subqueries, indexing, and transaction-related concepts. These topics are structurally connected, so a wrong answer often reflects a specific hidden misconception rather than a random mistake.
The real research problem addressed in this study is the lack of transparent, subtopic-level diagnosis in SQL learning environments.[1] Existing LMS-based assessments and many automated graders reduce the instructor workload, but they rarely connect an error to a formal ER-schema element, explain the probable cause of the error, and use this diagnosis to adapt to subsequent tasks.[2] As a result, students may focus on guessing or copying answers rather than systematically eliminating causal gaps in understanding.
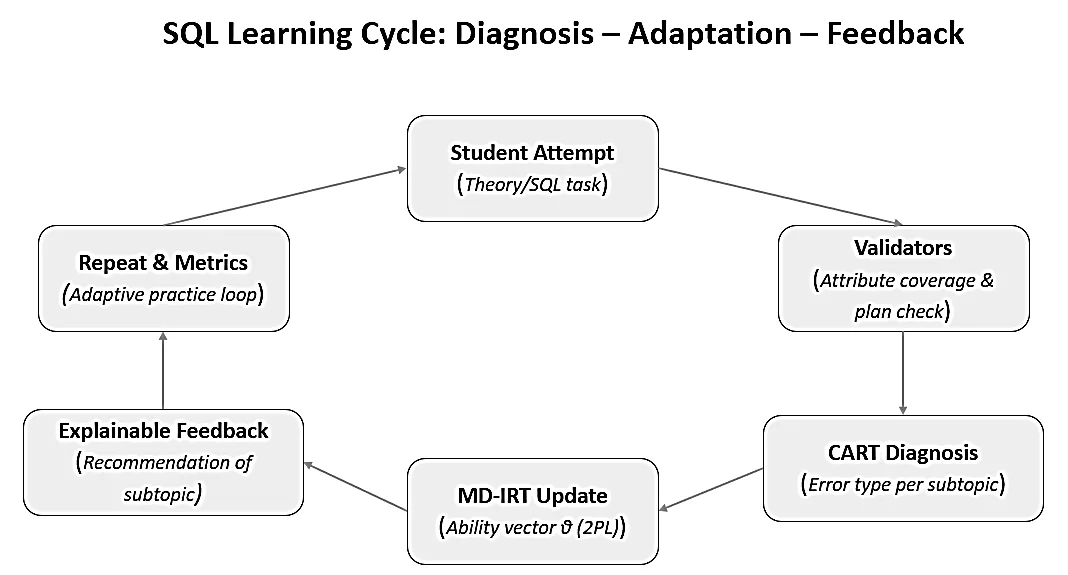
The purpose of this work is to present and validate a prototype of an intelligent SQL learning support system that: (i) links tasks to formal elements of an educational ER schema; (ii) diagnoses errors by subtopic and error type using validators and an interpretable CART model; (iii) generates explainable feedback and recommendations for weak subtopics; (iv) benchmarks the diagnostic classifier against alternative models; and (v) calibrates a pilot MIRT/Q-matrix layer for multidimensional competency analysis.
2. Literature Review and Positioning
2.1 Automated SQL assessment and intelligent tutoring systems
Early and established SQL learning systems demonstrate that automated feedback can support database education, but they differ in the depth of explanation and adaptivity. LEARN-SQL and Moodle-based assessment modules focus on automatic evaluation and scalable practice.[3-5] SQL-Tutor and constraint-based tutoring showed the educational value of diagnosing database-language misconceptions.[6,7] The SQLator and later automated SQL workbenches supported online practice and result-set checking.[8] Recent systems have also explored LLM-supported or neural grading of SQL queries.[9-11]
The present system is positioned in this line of work, but its distinguishing feature is the explicit link between the ER schema, validator rules, error taxonomy, expert labels, interpretable CART rules, and a psychometric Q-matrix. This link is intended to make feedback actionable: the student sees not only that an answer is wrong but also which subtopic and error mechanism require remediation.
2.2 Knowledge tracing, IRT, and adaptive learning
Adaptive learning systems typically rely on student modeling. Classical approaches include IRT and computerized adaptive testing, whereas modern approaches include Bayesian knowledge tracing, deep knowledge tracing (DKT), and dynamic key-value memory networks (DKVMNs).[12-15] These models estimate latent knowledge states from response histories and can support adaptive sequencing.
The prototype does not claim to outperform DKT, DKVMN, or other advanced knowledge-tracing approaches. Its objective is more interpretable: to combine schema-aware SQL validation, explainable error typing, and a multidimensional item-response representation.[16,17] This makes the system suitable for classroom contexts where instructors need auditable feedback rules and transparent evidence for recommendations.
2.3 Gap addressed by the study
The literature highlights three recurring needs: scalable SQL assessment, interpretable feedback, and adaptive sequencing of tasks. The proposed system addresses these needs by combining an educational ER schema, validators, L1–L6 markup, CART diagnostics, and a pilot MIRT/Q-matrix layer in one workflow. The revised study also includes the statistical and machine learning validation requested by the reviewers: significance testing, effect sizes, confidence intervals, training/validation/testing split, model benchmarking, confusion matrix, and correlation analysis.
3. Methodology
3.1 System architecture
The prototype combines four components: a web interface, an educational database, automatic validators, and a diagnostic module. The interface allows students to choose SQL/database topics, complete theory or SQL tasks, receive feedback, and review saved results. The educational database provides a controlled schema for generating and validating tasks. Validators check syntax, schema compliance, result-set equivalence, and constraint-related conditions. The diagnostic module classifies errors and updates the student profile. The main interface of the proposed system is shown in Fig. 1.

Fig. 1: Prototype interface for the SQL learning support system.
The educational database is a university schema containing the entities DEPARTMENT, PROGRAM, COURSE, INSTRUCTOR, STUDENT, CLASSROOM, SCHEDULE, ENROLLMENT, and MAJOR. This schema supports tasks on DDL, DML, SELECT, JOIN, GROUP BY, subqueries, constraints, and normalization. The structure of the educational database is illustrated in Fig. 2. The ER schema plays four roles. First, it is the source for task templates. Second, it defines the validator rules. Third, it anchors the L1 topic labels and L3 error types. Fourth, it supports the construction of a Q-matrix for multidimensional modeling. For example, an incorrect foreign key between ENROLLMENT and STUDENT is not treated as a generic wrong answer; it is mapped to schema mismatch or constraint violation in a specific relational subtopic.
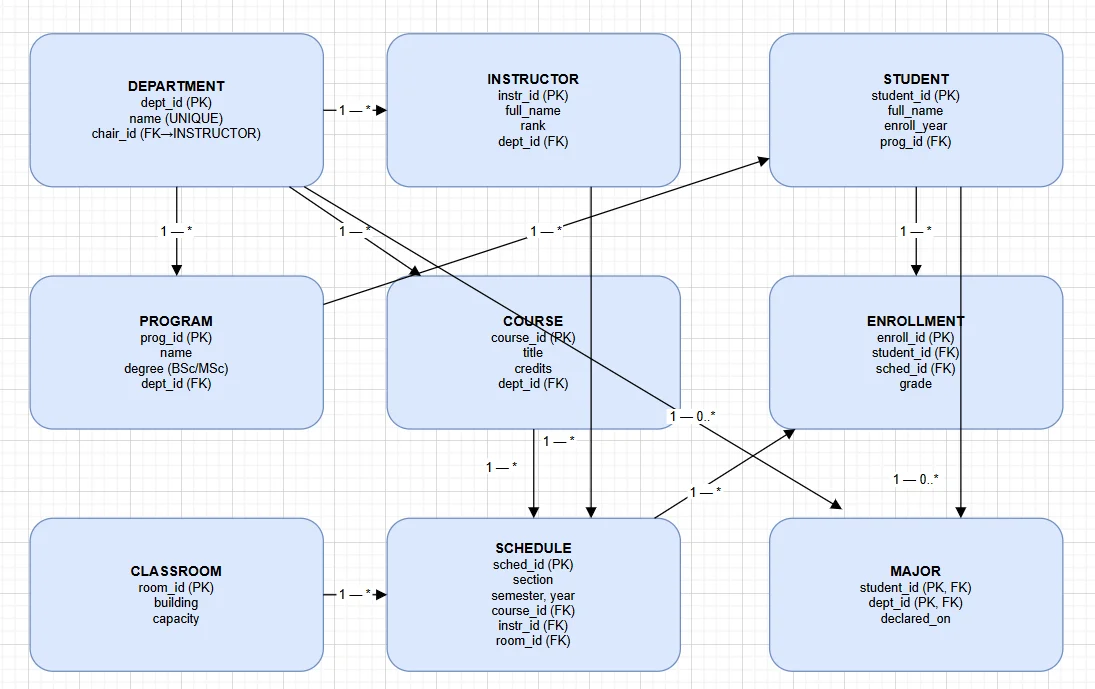
Fig. 2: ER scheme of the educational database “University”.
3.2 Topic taxonomy and error taxonomy
The markup scheme uses six layers. L1 identifies the topic or subtopic. L2 records the outcome as CORRECT, INCORRECT, or PARTIAL. L3 classifies the error type. L4 assigns difficulty. L5 records the Bloom cognitive level. L6 stores metadata such as response time, attempt number, task version, and source. Multiple topic labels are allowed for interdisciplinary tasks. The taxonomy of the SQL/database topics used for L1 markup is presented in Table 1, while the corresponding error taxonomy used for L3 classification is summarized in Table 2. The taxonomies presented in Tables 1 and 2 provide the semantic foundation for expert annotation, automated validation, error classification, and adaptive recommendation generation.
Table 1: Taxonomy of SQL/database topics used for L1 markup.
| Code | Subcode | Subject | Description |
|---|---|---|---|
| T1 | — | Tables and data types | Creating/modifying/deleting/updating Tables (DDL) |
| — | T1.1 | CREATE TABLE | Defining columns and data types, NULL/NOT NULL |
| — | T1.2 | ALTER/DROP TABLE | Changing or deleting database structure |
| — | T1.3 | Data types | Numeric, string, date/time, Boolean, special types |
| — | T1.4 | Keys | PRIMARY KEY, COMPOSITE KEY and candidate key reasoning |
| — | T1.5 | Constraints | UNIQUE, FOREIGN KEY, CHECK, DEFAULT |
| — | T1.6 | Indexes | CREATE INDEX, impact on performance |
| — | T1.7 | Normal forms | 1NF/2NF/3NF/BCNF; functional dependencies; anomalies |
| T2 | — | DML operation | INSERT, UPDATE, DELETE, safe modification |
| T3 | — | SELECT and filtering | Projection, WHERE, ORDER BY, LIMIT |
| T4 | — | JOIN and grouping | INNER/LEFT joins, aggregation, GROUP BY, HAVING |
| T5 | — | Subqueries and advanced SQL | Nested queries, EXISTS, IN, window functions |
Table 2: Error taxonomy used for L3 markup.
| No | ErrorType | Description |
|---|---|---|
| 1 | SYNTAX | SQL syntax error (missing comma, keyword order, typography) |
| 2 | SEMANTIC | Semantic error (wrong field/table, wrong type, incorrect logic) |
| 3 | SCHEMA_MISMATCH | Inconsistency with the database schema (referring to a nonexistent column/type, name conflict) |
| 4 | CONSTRAINT_VIOLATION | constraint violation (PK/UK/FK/CHECK/DEFAULT), incorrect key selection |
| 5 | NORMALIZATION | Violation of normal forms, functional dependencies, redundancy/anomalies |
| 6 | TERMINOLOGY | Confusion of concepts (for example, PK and UNIQUE; CHECK vs DEFAULT) |
| 7 | OTHER | Other error requiring manual specification |
3.3 Dataset, expert labels, and validation design
The revised analysis used the uploaded anonymized pilot workbook. It contained individual pretest and posttest scores, task-level responses, expert labels, training/validation/testing split information, classifier predictions, model metrics, Q-matrix information, item parameters, correlation values, and system logs. The main validation material is summarized in Table 3. As shown in Table 3, the revised analysis incorporates both educational and machine learning validation components, including expert-labeled responses, training/validation/testing partitions, classifier evaluation metrics, and MIRT calibration material.
Table 3: Dataset and validation material used in the revised analysis.
| Component | Value |
|---|---|
| Students | 60 total: 30 control and 30 experimental |
| Tasks | 30 SQL/database tasks |
| Attempts | 2,105 labeled attempts: 1,043 control and 1,062 experimental |
| Expert labels | 2,105 attempts labeled by two experts; observed agreement = 0.883; Cohen's kappa = 0.833 |
| Train/validation/test split | 1,473 train, 315 validation, 317 held-out test attempts. |
| Cross-validation folds | Five folds with 417-423 attempts per fold. |
| Classifier target | L3 error type: NONE, SYNTAX, SEMANTIC, SCHEMA_MISMATCH, CONSTRAINT_VIOLATION, NORMALIZATION, TERMINOLOGY, OTHER. |
| MIRT material | 60 x 30 item-response matrix and six-dimensional Q-matrix. |
The classifier input features included response time, attempt number, task type, difficulty, subtopic, prior SQL level, and group. The evaluation reported accuracy, macroprecision, macrorecall, macro-F1, weighted-F1, log-loss, per-class precision/recall/F1, and a confusion matrix. CART was compared with a majority baseline, logistic regression, random forest, and gradient boosting. For the learning outcomes, the pretest and posttest scores were analyzed at the student level. Within-group pre/post changes were tested with paired t tests. The difference in gains between groups was tested with Welch's independent-samples t test. Effect size was reported as paired Cohen's dz for within-group gains and Hedges' g for the between-group gain difference. Confidence intervals are reported at the 95% level. Nonparametric Wilcoxon and Mann–Whitney U tests were used as robustness checks.
3.4 CART diagnostic model
The prototype uses CART because decision trees provide interpretable splits and can be converted into diagnostic rules that instructors can inspect. At each node, the tree selects a feature and threshold that reduce impurity.
The entropy is
H(S) = − Σk=1K pk log2 pk (1)
where pk is the proportion of class k in the node. The Gini index is
G(S) = 1 − Σk=1K pk2 (2)
Information gain measures the reduction in impurity achieved after a split and serves as the primary criterion for selecting decision tree splits. The decision tree itself is trained by impurity reduction, while the probabilistic feedback quality is evaluated with cross-entropy/log-loss on the held-out test set. This distinction is important: log-loss is not the splitting criterion of a standard CART tree, but it is useful for assessing whether the predicted class probabilities are calibrated enough for educational feedback.
3.5 MIRT/Q-matrix calibration
The revised manuscript no longer treats MD-IRT/MIRT as an unsupported future claim. The uploaded dataset contains a pilot 60 x 30-item response matrix, a Q-matrix, and item parameter estimates. The Q-matrix represents six dimensions: DDL, DML, JOIN, Aggregation, Normalization, and Constraints. The number of items loading on these dimensions was as follows: DDL = 5, DML = 7, JOIN = 6, Aggregation = 6, Normalization = 4, and Constraints = 8. The total exceeds 30 because several items load on more than one competence dimension.
For a multidimensional 2PL model, the probability of a correct response to item j can be written as follows:
P(Xij = 1|θi) = 1 / [1 + exp(−(ajTθi − bj))] (3)
where θi is the student ability vector, aj is the vector of item loadings, bj is item difficulty, and sigma is the logistic function. In the pilot calibration, item difficulty ranged from -0.92 to 1.28 (mean = 0.28), discrimination ranged from 0.57 to 1.55 (mean = 1.00), mean item information was 0.264, and the mean fit statistic was 0.980. These values are preliminary because the calibration is based on only 60 students.
4. Results and Discussion
4.1 Learning outcomes and statistical validation
Table 4 reports the student-level pretest and posttest results. The baseline scores were similar: the experimental group started 0.50 percentage points lower than the control group did, and this difference was not statistically significant (Welch t(57.50) = -0.34, p = 0.733).
Table 4: Student-level pretest, posttest, and gain scores.
| Group | n | Pretest mean (SD) | Posttest mean (SD) | Gain mean (SD) | 95% CI for gain |
|---|---|---|---|---|---|
| Control | 30 | 64.30 (5.38) | 68.09 (5.75) | 3.79 (2.84) | [2.73; 4.85] |
| Experimental | 30 | 63.80 (5.91) | 81.60 (8.26) | 17.80 (4.76) | [16.02; 19.58] |
As shown in Tables 4 and 5, compared with the control group, the experimental group achieved substantially larger gains across all the statistical indicators. The difference in gains remained significant under both the parametric and nonparametric testing procedures.
The experimental group improved by 17.80 percentage points, whereas the control group improved by 3.79 percentage points. The difference in gain was 14.01 percentage points, with a 95% confidence interval from 11.98 to 16.05 percentage points. The descriptive gain ratio is 4.70 (17.80/3.79), but the evidential claim is based on the statistical tests, confidence interval, and effect size rather than on the ratio alone. These differences are visually summarized in Fig. 3.
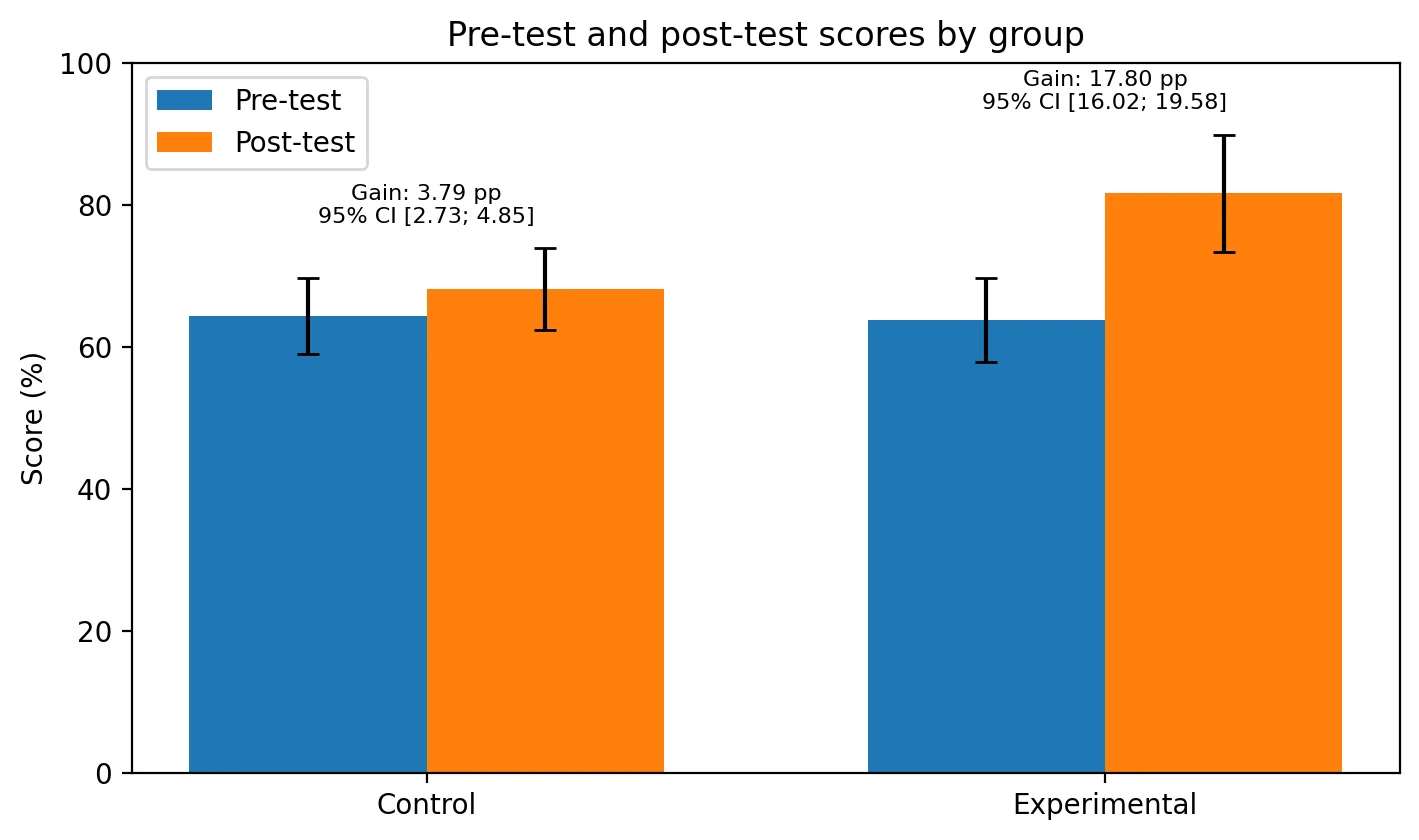
Fig. 3: Pretest and posttest scores by group with confidence intervals.
Table 5: Inferential tests for learning outcomes.
| Comparison | Test | Statistic | p value | Effect size | Interpretation |
|---|---|---|---|---|---|
| Control pre/post | Paired t test | t(29) = 7.31 | < 0.001 | Cohen dz = 1.34 | Significant within-group gain. |
| Experimental pre/post | Paired t test | t(29) = 20.50 | < 0.001 | Cohen dz = 3.74 | Significant within-group gain. |
| Experimental gain vs. control gain | Welch t test | t(47.30) = 13.86 | < 0.001 | Hedges g = 3.53 | Experimental gain significantly exceeded control gain. |
| Baseline pretest difference | Welch t test | t(57.50) = -0.34 | 0.733 | — | No significant baseline difference. |
| Gain difference robustness | Mann–Whitney U | U = 888.5 | < 0.001 | — | Nonparametric result confirms the gain difference. |
Additional student-level indicators support the interpretation that feedback was associated with improved performance. The experimental group had fewer total errors on average than the control group did (12.80 vs. 19.57; p < 0.001), more feedback events (12.80 vs. 4.00; p < 0.001), and a higher final task completion rate (75.33% vs. 50.67%; p < 0.001). Syntax errors and semantic errors were also lower in the experimental group.
4.2 Classifier benchmarking
Table 6 presents the benchmark on the held-out test set of 317 attempts. CART outperformed the majority baseline and logistic regression, but random forest and gradient boosting achieved higher predictive scores. This is expected because ensemble methods can capture more complex patterns. However, CART remains appropriate for the main diagnostic contour because the goal is explainable educational feedback rather than maximum black-box accuracy.[18-20]
Table 6: Classifier benchmark on the held-out test set.
| Model | Accuracy | Macro-P | Macro-R | Macro-F1 | Weighted-F1 | Log-loss | n test |
|---|---|---|---|---|---|---|---|
| Majority baseline | 0.536 | 0.067 | 0.125 | 0.087 | 0.374 | 1.105 | 317 |
| Logistic regression | 0.678 | 0.565 | 0.691 | 0.609 | 0.697 | 0.745 | 317 |
| CART | 0.779 | 0.655 | 0.751 | 0.689 | 0.793 | 0.618 | 317 |
| Random forest | 0.855 | 0.756 | 0.805 | 0.775 | 0.858 | 0.508 | 317 |
| Gradient boosting | 0.852 | 0.748 | 0.816 | 0.776 | 0.855 | 0.507 | 317 |
The comparative performance of the evaluated machine learning models is illustrated in Fig. 4.
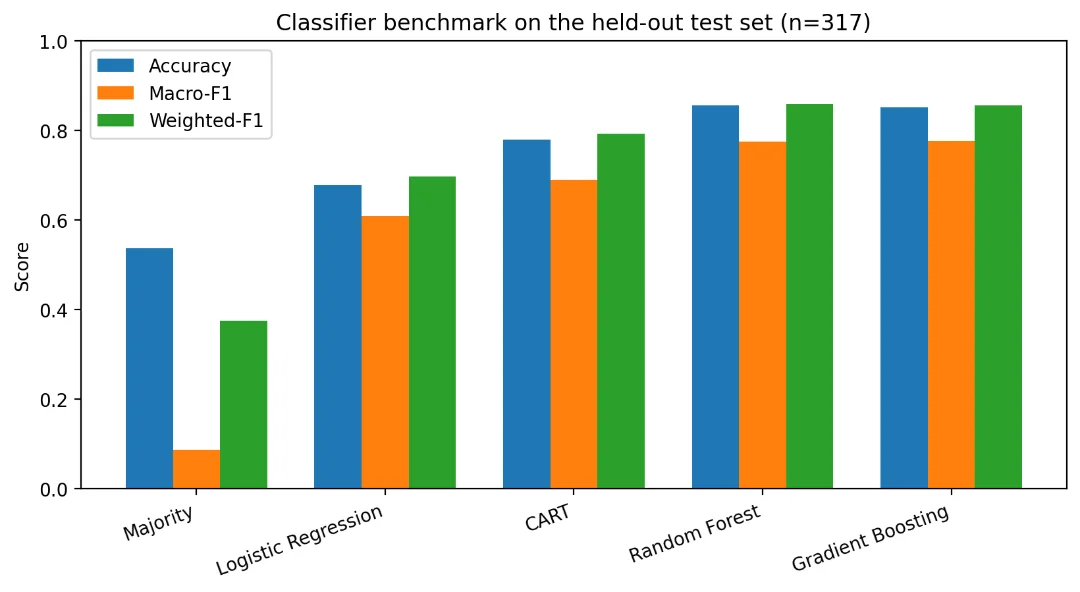
Fig. 4: Comparative ML benchmark for error-type classification.
For CART, the strongest class-level result was obtained for NONE errors (F1 = 0.887), followed by NORMALIZATION (F1 = 0.788), SEMANTIC (F1 = 0.744), TERMINOLOGY (F1 = 0.737), and SCHEMA_MISMATCH (F1 = 0.711). The performance was lower for CONSTRAINT_VIOLATION (F1 = 0.500) and OTHER (F1 = 0.553), which is consistent with their lower support and more heterogeneous semantic content. The detailed class-level performance metrics are reported in Table 7. To further examine the diagnostic behavior of the classifier, the confusion matrix for the held-out test set is presented in Fig. 5.
Table 7: CART per-class precision, recall, and F1 score.
| Class | Support | Precision | Recall | F1 |
|---|---|---|---|---|
| NONE | 170 | 0.979 | 0.812 | 0.887 |
| SYNTAX | 23 | 0.516 | 0.696 | 0.593 |
| SEMANTIC | 42 | 0.727 | 0.762 | 0.744 |
| SCHEMA_MISMATCH | 23 | 0.727 | 0.696 | 0.711 |
| CONSTRAINT_VIOLATION | 7 | 0.385 | 0.714 | 0.500 |
| NORMALIZATION | 15 | 0.722 | 0.867 | 0.788 |
| TERMINOLOGY | 19 | 0.737 | 0.737 | 0.737 |
| OTHER | 18 | 0.448 | 0.722 | 0.553 |
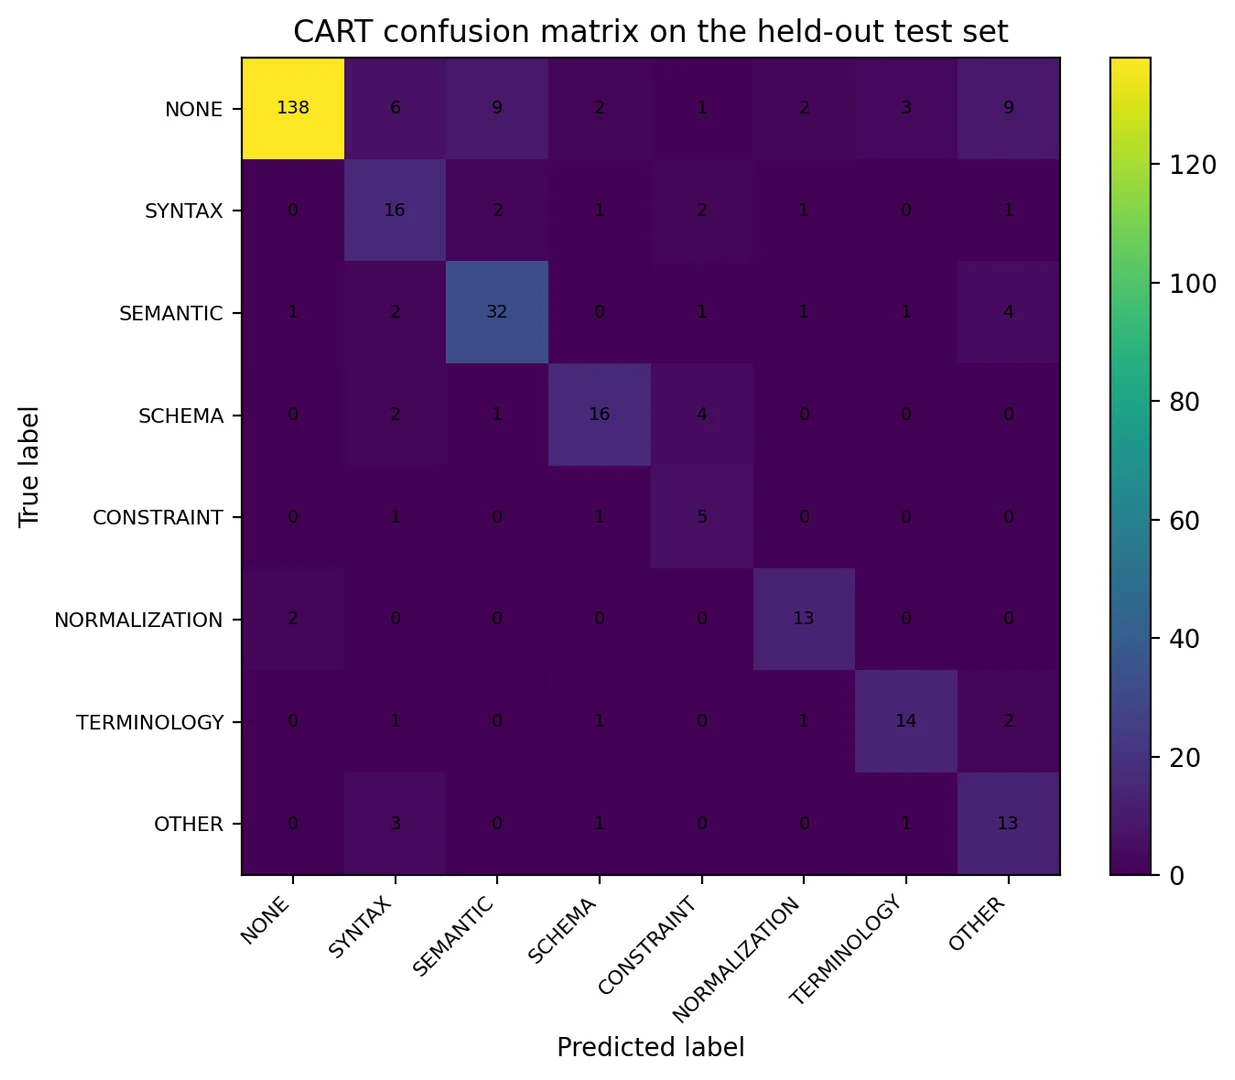
Fig. 5: CART confusion matrix on the held-out test set.
As shown in Fig. 5, most misclassifications occurred between semantically related error categories, particularly SEMANTIC, SCHEMA_MISMATCH, and TERMINOLOGY errors. In contrast, the classifier demonstrated strong recognition of correctly solved tasks (NONE) and NORMALIZATION-related errors, which is consistent with the class-level F1 scores reported in Table 7.
4.3 Correlation analysis and diagnostic interpretation
Correlation analysis was performed on the student-level aggregate indicators. The strongest association was between the posttest score and the total number of errors (r = -0.889; p < 0.001), indicating that students with fewer logged errors tended to achieve higher final scores. The gain score was negatively correlated with total errors (r = -0.624; p < 0.001) and positively correlated with the feedback count (r = 0.388; p = 0.002). The posttest score was also negatively associated with semantic errors (r = -0.674; p < 0.001) and syntax errors (r = -0.627; p < 0.001). The relationships among the main student-level indicators are visualized in the correlation matrix shown in Fig. 6.
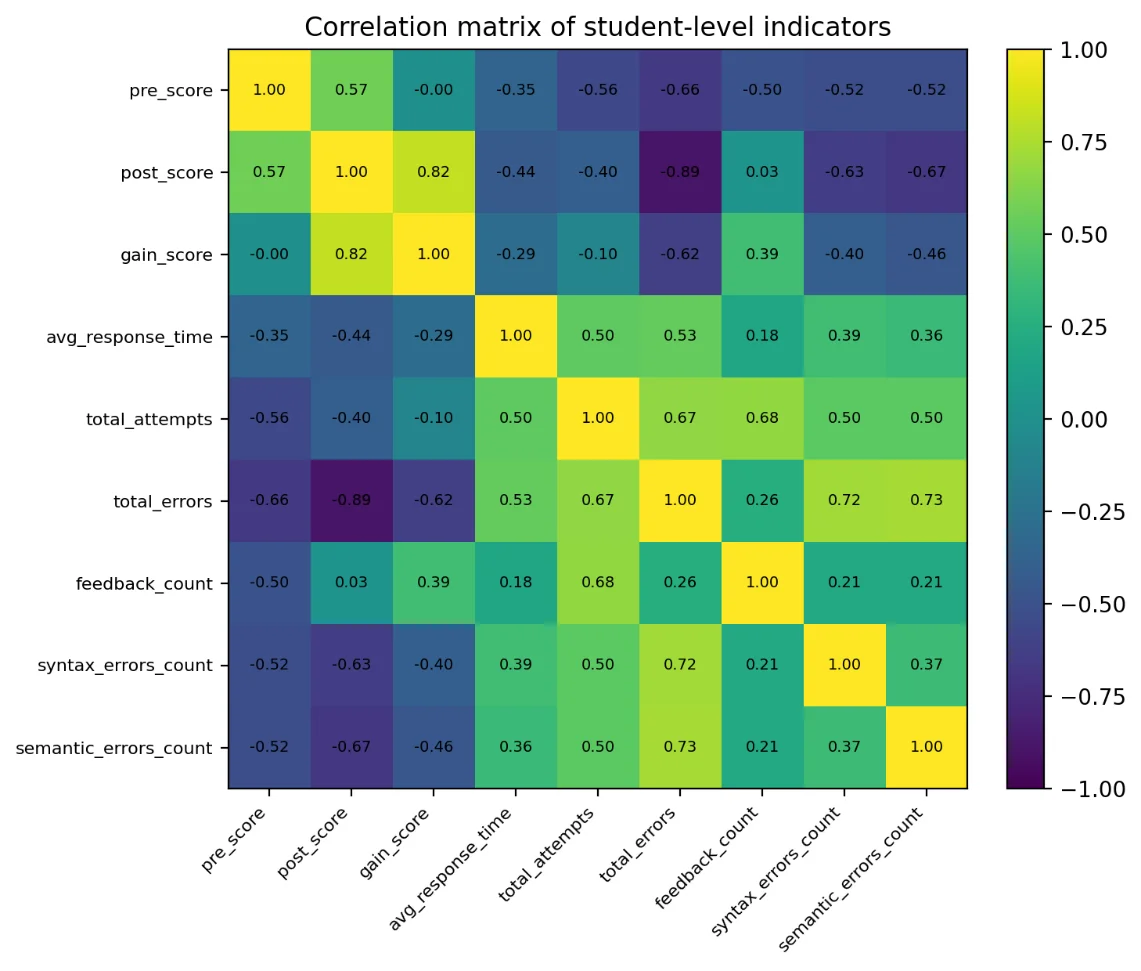
Fig. 6: Correlation matrix of student-level indicators.
These correlations do not by themselves prove causality, but they provide supporting diagnostic evidence. A negative relationship between errors and posttest score is expected, whereas a positive association between feedback count and gain is consistent with the role of adaptive remediation. The pattern supports the system design: feedback is most valuable when it is tied to a concrete error type and subtopic rather than to a generic wrong-answer message.
4.4 MIRT/Q-matrix results
To complement the classifier-based diagnostics, a pilot multidimensional item response theory (MIRT) analysis was conducted using a 60 x 30 item-response matrix and a six-dimensional Q-matrix covering DDL, DML, JOIN, Aggregation, Normalization, and Constraints. The resulting calibration statistics are summarized in Table 8. The MIRT/Q-matrix layer addresses the reviewer's concern that the psychometric component should not be presented only conceptually. In the revised analysis, it is reported as a pilot calibration with a concrete response matrix, Q-matrix, and item parameter summaries. Nevertheless, the sample size remains small for stable multidimensional calibration. Therefore, these results should be interpreted as preliminary evidence of feasibility rather than as a final psychometric validation.
Table 8: Pilot MIRT/Q-matrix calibration summary.
| MIRT/Q-matrix indicator | Pilot value |
|---|---|
| Number of items | 30 |
| Number of students in item-response matrix | 60 |
| Competence dimensions | DDL, DML, JOIN, Aggregation, Normalization, Constraints |
| Mean item difficulty b | 0.28; range [-0.92; 1.28] |
| Mean item discrimination a | 1.00; range [0.57; 1.55] |
| Mean item information | 0.264 |
| Mean fit statistic | 0.980 |
5. Limitations
This study has several limitations. First, the sample includes only 60 students from one educational context, so the results should be generalized cautiously. Second, although the response-level workbook supports statistical testing and ML benchmarking, broader validation should use larger cross-institutional datasets and independent replications. Third, some error classes have low support, especially CONSTRAINT_VIOLATION, which reduces the stability of class-level F1 estimates. Fourth, compared with the ensemble models, the CART model is intentionally interpretable but less accurate. Fifth, the MIRT/Q-matrix calibration is preliminary because multidimensional item-response models usually require larger samples for stable parameter estimation. Finally, the study does not explicitly consider the interaction between SQL and NoSQL paradigms, which have been discussed in prior research as complementary approaches in modern data systems.[21]
6. Conclusion
This paper presents an intelligent SQL learning support system that connects an educational ER schema with validator-based error typing, L1–L6 markup, explainable CART diagnostics, adaptive feedback, and a pilot MIRT/Q-matrix layer. The revised analysis directly addresses the reviewers' methodological concerns by adding individual-level statistical testing, confidence intervals, effect sizes, model benchmarking, confusion matrix analysis, correlation analysis, expert-label agreement, and item-parameter summaries. Compared with the control group, the experimental group achieved a substantially greater learning gain (+17.80 pp versus +3.79 pp), and the difference in the effect size was statistically significant. CART provided an interpretable diagnostic model with acceptable performance on the held-out test set, whereas random forest and gradient boosting established stronger predictive baselines. These findings support the feasibility of explainable AI feedback for SQL education. Future work will extend the dataset, validate the system across institutions, improve low-support error categories, compare CART-based diagnosis with advanced knowledge tracing models such as DKT and DKVMN, and expand the framework beyond relational databases. Given the growing adoption of NoSQL data models in modern information systems, future research will extend the framework to document-oriented and key-value environments by adapting the error taxonomy and validation rules to the characteristics of alternative data models.
Acknowledgments
The authors would like to thank the Department of Software Engineering at Akhmet Baitursynuly Kostanay Regional University and the students (n = 60) of the “Information Technologies and Robotics” program for their participation in the pilot evaluation of the proposed system. This research received no external funding. All the data were anonymized and processed in accordance with institutional policies.
CRediT Author Contribution Statement
Gulmira Baenova: Conceptualization; Formal Analysis; Investigation; Methodology; Software; Supervision; Visualization, Writing – Original draft; Writing – Review & editing. Bakhtiyar Zharlykassov: Data curation; Formal analysis; Investigation; Project administration; Resources; Software; Validation; Writing – Review & editing. Kalybek Maulenov: Data curation; Formal analysis; Investigation; Project administration; Resources; Validation; Writing – Review & editing. Aierke Syzdykova: Writing – Review & editing; Visualization.
Funding Declaration
This research did not receive any specific grant from funding agencies in the public, commercial, or not-for-profit sectors.
Data Availability Statement
The datasets generated and/or analyzed during the current study are not publicly available due to confidentiality restrictions but are available from the corresponding author upon reasonable request.
Conflict of Interest
There is no conflict of interest.
Artificial Intelligence (AI) Use Disclosure
The authors confirm that no artificial intelligence (AI)-assisted technologies were used in the writing of the manuscript, and no images were generated or manipulated using AI. AI-based tools were used solely for language editing to improve grammar, clarity, and readability, in accordance with journal policy. The authors take full responsibility for the accuracy, originality, and integrity of the work.
Supporting Information
Not applicable.
References
- [1] A. Gaitantzi, I. Kazanidis, The role of artificial intelligence in computer science education: A systematic review with a focus on database instruction, Applied Sciences, 2025, 15, 3960, doi: 10.3390/app15073960.
- [2] S. A. D. Popenici, S. Kerr, Exploring the impact of artificial intelligence on teaching and learning in higher education, Research and Practice in Technology Enhanced Learning, 2017, 12, 22, doi: 10.1186/s41039-017-0062-8.
- [3] A. Ouared, M. Amrani, P.-Y. Schobbens, Learning Analytics Solution for Monitoring and Analyzing the Students' Behavior in SQL Lab Work, Proceedings of the 15th International Conference on Computer Supported Education - Volume 2: CSEDU, SciTePress, 2023, 184-195, doi: 10.5220/0011848200003470.
- [4] C. Sánchez, O. Ramos, P. Márquez, E. Marti, J. Rocarias, D. Gil, Automatic evaluation of practices in Moodle for self-learning in engineering, Journal of Technology and Science Education, 2015, 5, 97-106, doi: 10.3926/jotse.146.
- [5] A. Abelló, M. E. Rodriguez, T. Urpi, X. Burgues, M. J. Casany, C. Martin, C. Quer, LEARN-SQL: Automatic assessment of SQL based on IMS QTI specification, The 8th IEEE International Conference on Advanced Learning Technologies, ICALT 2008, Santander, Cantabria, Spain, 2008, 592-593, doi: 10.1109/ICALT.2008.27.
- [6] A. Mitrovic, Learning SQL with a computerized tutor, ACM SIGCSE Bulletin, 1998, 30, 307-311, doi: 10.1145/274790.274318.
- [7] A. Mitrovic, S. Ohlsson, Evaluation of a constraint-based tutor for a database language, International Journal of Artificial Intelligence in Education, 1999, 10, 238-256.
- [8] S. Sadiq, M. Orlowska, W. Sadiq, J. Lin, SQLator: An online SQL learning workbench, ACM SIGCSE Bulletin, 2004, 36, 223-227, doi: 10.1145/1026487.1008055.
- [9] K. Manikani, R. Chapaneri, D. Shetty, D. Shah, SQL Autograder: Web-based LLM-powered autograder for assessment of SQL queries, International Journal of Artificial Intelligence in Education, 2024, 35, 2047–2077, doi: 10.1007/s40593-025-00460-2.
- [10] S. A. Reid, F. Kammer, J. Kunz, T. Pellekoorne, M. Siepermann, J. Wölfer, ItsSQL: Intelligent Tutoring System for SQL, arXiv:2311.10730, 2023, doi: 10.48550/arXiv.2311.10730.
- [11] D. R. Schwartz, P. Rivas, An automated SQL query grading system using an attention-based convolutional neural network, arXiv:2406.15936, 2024, doi: 10.48550/arXiv.2406.15936.
- [12] J. C. Immekus, K. E. Snyder, P. A. Ralston, Multidimensional item response theory for factor structure assessment in educational psychology research, Frontiers in Education, 2019, 4, 45, doi: 10.3389/feduc.2019.00045.
- [13] M. D. Reckase, Multidimensional item response theory, Springer Science & Business Media, 2009, 354, doi: 10.1007/978-0-387-89976-3.
- [14] C. Piech, J. Bassen, J. Huang, S. Ganguli, M. Sahami, L. J. Guibas, J. Sohl-Dickstein, Deep knowledge tracing, Advances in Neural Information Processing Systems, 2015.
- [15] J. Zhang, X. Shi, I. King, D.-Y. Yeung, Dynamic key-value memory networks for knowledge tracing, WWW '17: Proceedings of the 26th International Conference on World Wide Web, 2017, 765–774, doi: 10.1145/3038912.3052580.
- [16] S. Shen, Q. Liu, Z. Huang, Y. Zheng, M. Yin, M. Wang, E. Chen, A survey of knowledge tracing: models, variants, and applications, IEEE Transactions on Learning Technologies, 2024, 17, 1898-1919, doi: 10.1109/TLT.2024.3383325.
- [17] C. Boisvert, K. Domdouzis, J. Licence, A comparative analysis of student SQL and relational database knowledge using automated grading tools, International Symposium on Computers in Education (SIIE), 2018, doi: 10.1109/SIIE.2018.8586684.
- [18] A. Létourneau, M. D. Martineau, P. Charland, J. Alexander Karran, J. Boasen, P. M. Léger, A systematic review of AI-driven intelligent tutoring systems (ITS) in K-12 education, npj Science of Learning, 2025, 10, doi: 10.1038/s41539-025-00320-7.
- [19] M. Potla, S. S. Gunupuru, M. Boicu, Comparative evaluation of AI assistants for SQL education through prompt engineering techniques, Journal of Student-Scientists' Research, 2025, 7, doi: 10.13021/jssr2025.5170.
- [20] L. Breiman, J. H. Friedman, R. A. Olshen, C. J. Stone, Classification and regression trees, Taylor & Francis, 1984, 368.
- [21] D. Kumawat, A. Pavate, Correlation of NOSQL & SQL database, IOSR Journal of Computer Engineering, 2016, 18, 70-74.
Publisher Note: The views, statements, and data in all publications solely belong to the authors and contributors. GR Scholastic is not responsible for any injury resulting from the ideas, methods, or products mentioned. GR Scholastic remains neutral regarding jurisdictional claims in published maps and institutional affiliations.
Open Access
This article is licensed under a Creative Commons Attribution-NonCommercial 4.0 International License, which permits the non-commercial use, sharing, adaptation, distribution and reproduction in any medium or format, as long as appropriate credit to the original author(s) and the source is given by providing a link to the Creative Commons License and changes need to be indicated if there are any. The images or other third-party material in this article are included in the article's Creative Commons License, unless indicated otherwise in a credit line to the material. If material is not included in the article's Creative Commons License and your intended use is not permitted by statutory regulation or exceeds the permitted use, you will need to obtain permission directly from the copyright holder. To view a copy of this License, visit: https://creativecommons.org/licenses/by-nc/4.0/
© The Author(s) 2026