

 Open Access||Review Article
A Comprehensive Review of Remote Sensing and Artificial Intelligence-Based Smart Agriculture for Assessing Climate Change Impacts

School of Sciences, P P Savani University, Kosamba, Surat, Gujarat, 394125, India
Abstract
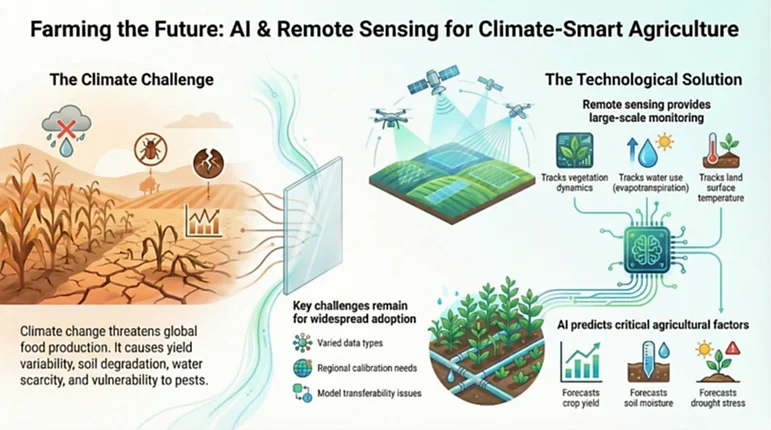
Climate change poses a profound threat to global agriculture, leading to yield variability, soil degradation, water scarcity, and increased vulnerability to pests and diseases. Over the past decade, Remote Sensing (RS) has emerged as a transformative tool in understanding, detecting, and mitigating these impacts. A wide body of research demonstrates that AI-driven models, particularly machine learning and deep learning techniques, are effective in predicting crop yield, drought stress, and soil moisture variability, while remote sensing provides large-scale, high-resolution monitoring of vegetation dynamics, evapotranspiration, and land surface temperature. Recent studies highlight advances in multi-sensor data fusion, cloud-based platforms, and AI-enhanced climate models that enable more precise and timely assessments. Despite these advances, challenges remain in terms of data heterogeneity, the need for regional calibration, and the limited transferability of models across agro-climatic zones. This review synthesizes recent progress in AI- and RS-based agricultural monitoring under climate change, critically evaluates their applications and limitations, and identifies future research directions such as explainable AI, integration with socio-economic data, and the development of localized climate-smart decision-support systems.
Keywords
Graphical Abstract
Novelty Statement
This review synthesizes recent progress in AI- and RS-based agricultural monitoring under climate change, critically evaluates their applications and limitations, and identifies future research directions.
1. Introduction
1.1 The global challenge: food security under climatic stress
Global agriculture, the foundation of human sustenance and economic stability, is confronting a challenge of unparalleled scope and complexity. The intensifying effects of climate change represent a significant threat to food security, a sector vital to the global population.[1] This worldwide disruption is primarily caused by the excessive buildup of greenhouse gases (GHGs), mainly carbon dioxide (CO2) and methane, in the atmosphere. These emissions, stemming from human activities like burning fossil fuels, industrial processes, and extensive deforestation, have profoundly altered the planet's climate systems.[2] The outcomes are extensive, manifesting as a continuous increase in global average temperatures, major shifts in precipitation patterns, and a notable rise in the frequency and severity of extreme weather events. These climatic changes collectively weaken the stability and output of agricultural systems globally, endangering the livelihoods of billions and the security of the global food supply.[2] The connection between agriculture and climate change is a complex feedback loop, not a one-way street. The agricultural sector is not merely a casualty of climate change but also a major contributor to the issue. On a global scale, agriculture is responsible for a large share of GHG emissions, contributing an estimated 65-80% of all nitrous oxide (NO) emissions, which are mainly produced by livestock, feedlots, and the use of nitrogen-based fertilizers on cultivated lands.[2] This dynamic fosters a detrimental cycle: agricultural practices release GHGs that fuel climate change, which, in turn, creates unfavorable conditions that harm agricultural systems. This feedback loop highlights the critical need to develop solutions that can both strengthen agriculture's ability to adapt and lessen its environmental impact. Consequently, any technological or policy measure must tackle both aspects of this crucial relationship, building resilience to the impacts farmers are already experiencing while encouraging practices that curb future emissions, as illustrated in Fig. 1.
1.2 Key climate-induced agricultural disruptions: yield, soil, and water
The consequences of climate change for agriculture are diverse, touching almost every aspect of the production system. These disruptions are primarily seen in greater yield fluctuations, ongoing soil degradation, and increasing water shortages.
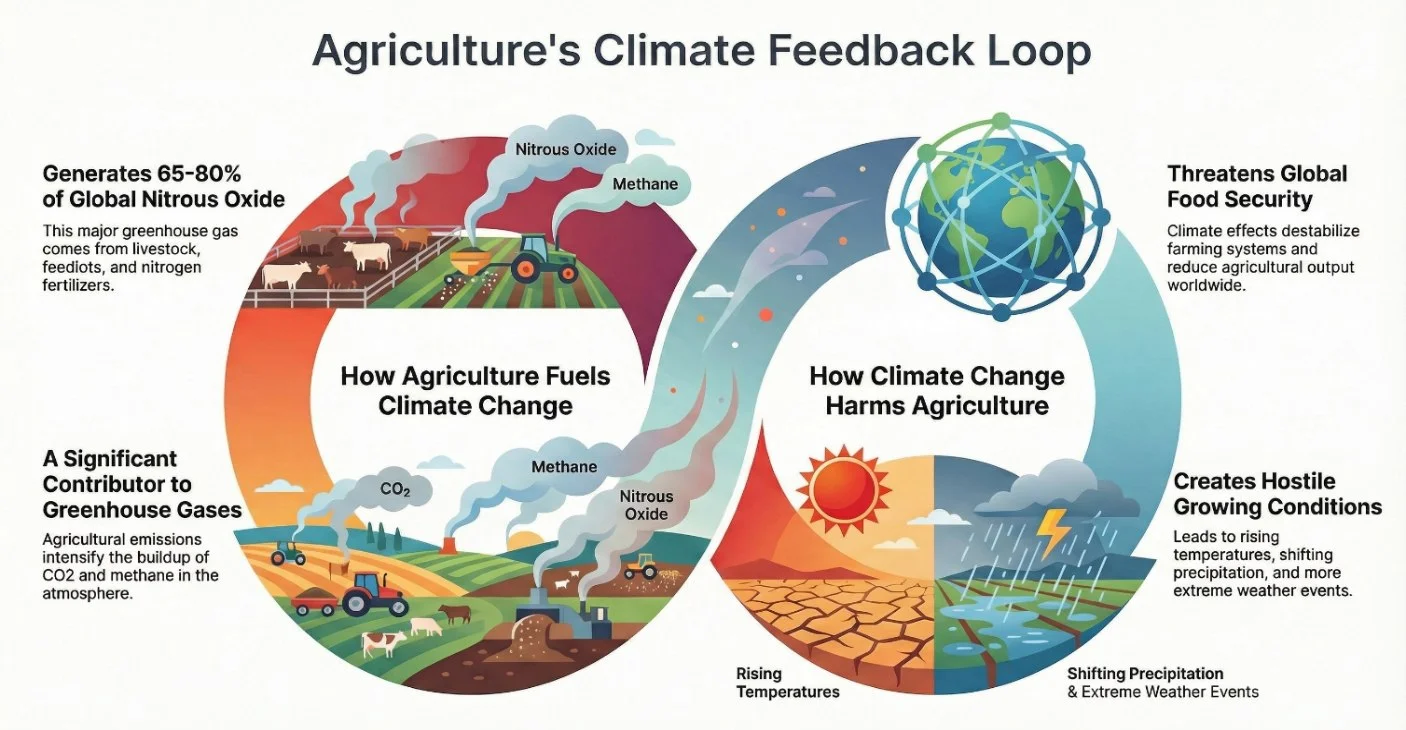
Fig. 1: Agriculture's climate feedback loop.
Yield variability: A primary and economically detrimental effect of climate change is the heightened variability and general decline in crop yields. Escalating temperatures, prolonged heat waves, and modified rainfall patterns interfere with plant development stages, disrupt growth cycles, and cause heat stress, resulting in lower yields for key crops like corn, rice, and wheat. Even when farmers adopt adaptive measures, such as adjusting planting schedules or switching crop varieties, the overall trend indicates substantial losses. Projections for future climate scenarios are alarming; for example, some crop models foresee yield decreases of up to 15.2% for rice and 14.1% for wheat in susceptible areas.[3] A comprehensive analysis that accounts for farmer adaptation projects that in a high-emissions future, global yields of calories from staple crops will be 24% lower in 2100 than they would be without climate change. This instability not only endangers the global food supply but also threatens the financial security of farming communities, especially in developing nations where agriculture is the main source of income and food. The unequal distribution of these impacts is a major issue, as marginalized groups often do not have the financial means, technology, or institutional backing needed to adjust to changing environmental conditions, leaving them highly exposed to food insecurity and economic hardship. Rural communities in arid and semi-arid areas, who already deal with scarce resources, are among the most vulnerable.[3]
Soil degradation: Climate change presents a significant danger to the health and productivity of agricultural soils. The warmer air temperatures of recent decades are anticipated to create a more intense water cycle, marked by more common and severe rainfall. This increased precipitation directly heightens the risk of soil erosion, a major environmental danger to sustainable farming. Additionally, higher soil temperatures speed up the microbial breakdown of soil organic matter. This action strips the soil of vital nutrients and releases stored carbon into the atmosphere, adding to global warming. The combined result of these actions is a marked decline in soil quality and fertility, which consequently affects crop growth and output.[4] In the long run, this degradation can cause major losses of soil carbon, with some research projecting losses as high as 22% over 50 years in agricultural areas affected by erosion.[4]
Water scarcity and quality: The reliability of water resources, essential for all agricultural output, is being seriously threatened by climate change. Altered precipitation patterns are causing more frequent and intense droughts in some areas, while others are hit by catastrophic floods, both of which interfere with planting and harvesting and harm agricultural infrastructure. In coastal farming areas, the danger is increased by rising sea levels. The flow of saltwater into freshwater sources and wells can make them unsuitable for irrigation once salt levels pass a certain point.[4] This problem is especially severe in low-lying delta areas, like the Mekong Delta in Vietnam, where a large amount of the world's rice is grown and is extremely susceptible to flooding and salinization, as shown in Fig. 2.
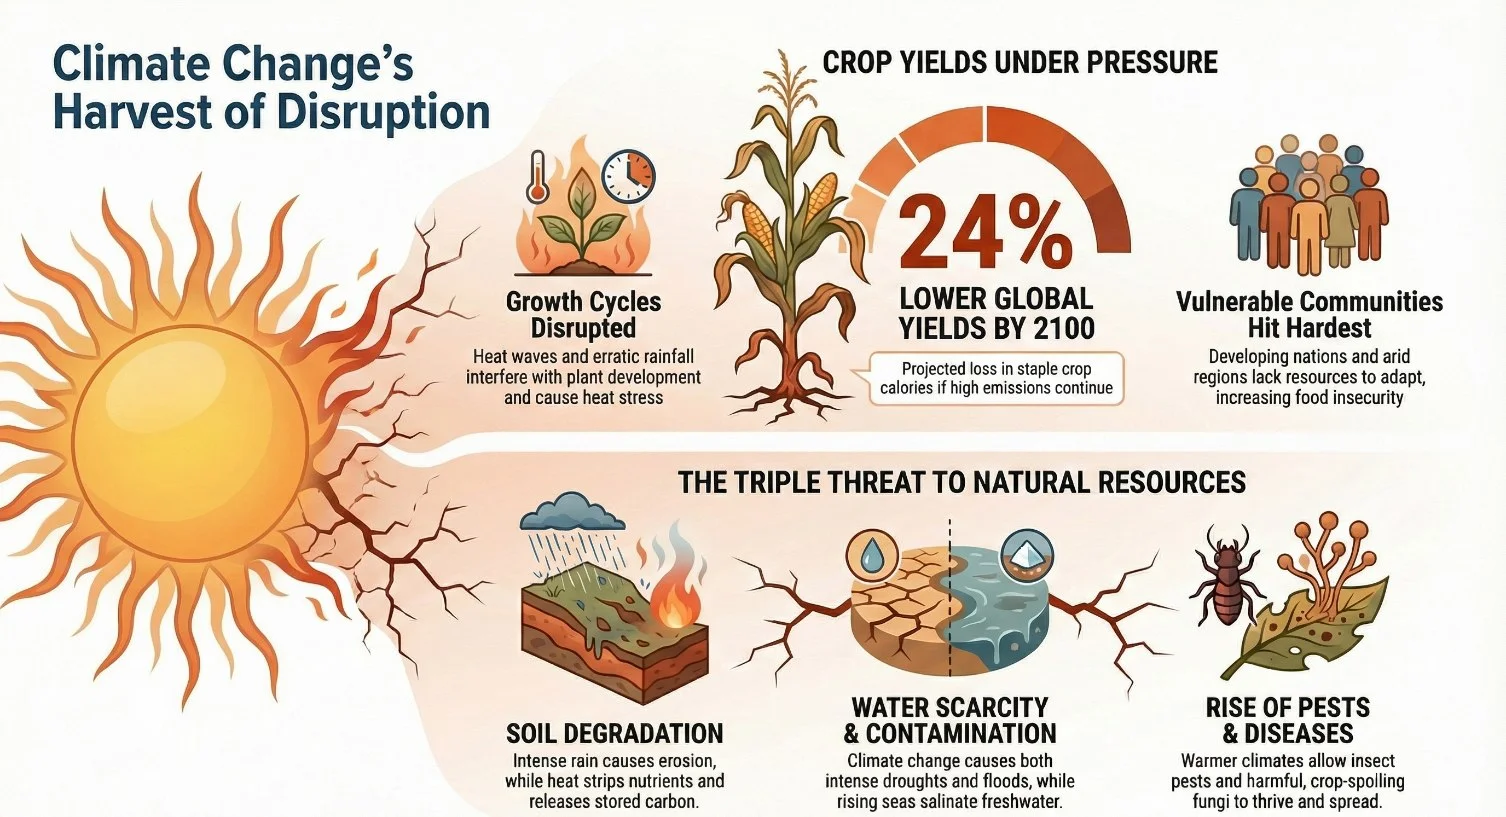
Fig. 2: Climate condition in crop yields.
Pests and diseases: In addition to the direct effects on crops, soil, and water, climate change is reshaping the patterns of agricultural pests and diseases. Higher temperatures and different humidity levels are creating better environments for the proliferation and spread of many insect pests, harmful bacteria, and fungi. This includes a greater danger from fungi that produce mycotoxins, such as Aspergillus, which can spoil crops and present a major risk to food safety.[5] The rise of new pest and disease threats forces farmers to create new management plans, often leading to greater use of chemical products and making the goal of sustainable farming more complex.
1.3 The technological response: an overview of RS and AI as transformative tools
To address this intricate network of climate-related challenges, a formidable technological approach has developed at the crossroads of Earth observation and data science. Remote Sensing (RS) and Artificial Intelligence (AI) are being combined more frequently to offer groundbreaking tools for observing, comprehending, identifying, and lessening the effects of climate change on agriculture. RS technologies, utilized on satellites and unmanned aerial vehicles (UAVs), make it possible to monitor large agricultural areas with high spatial and temporal detail, delivering impartial and current data on vegetation changes, soil states, and water levels. This flood of Earth observation data, however, would be unmanageable without the analytical strength of AI. AI, particularly its branches of machine learning (ML) and deep learning (DL), offers the sophisticated computational tools required to handle these huge datasets, spot intricate patterns, and produce predictive insights. The collaboration between RS and AI is ushering in a new phase of data-led agriculture. This combination is the foundation of precision agriculture and climate-smart farming, supporting the creation of advanced decision-support systems that assist farmers in optimizing resource use, strengthening the resilience of their farms, and adjusting to the new realities of a changing climate.[6] By delivering practical intelligence at the field, farm, and regional levels, these technologies have the potential to guide global agriculture toward a more sustainable, productive, and climate-resilient future.
2. The Remote Sensing Toolkit: Monitoring Agriculture from Above
2.1 Foundational principles: from electromagnetic radiation to actionable data
Remote sensing is the field of science and technology dedicated to gathering information about the Earth's surface from a distance, usually from satellites or aircraft. The core idea is to detect and measure electromagnetic radiation that is either reflected or emitted by objects on the ground.[7] Every object on the Earth's surface interacts with solar energy in a distinct way, absorbing some wavelengths while reflecting others. This unique spectral signature enables sensors to differentiate between various features, such as healthy plants, stressed crops, bare ground, or bodies of water.[7] Remote sensing systems are generally divided into two types based on their energy source: passive and active systems, as shown in Fig. 3. Passive systems depend on an outside energy source, most often the sun. They are fitted with sensors that gauge the solar radiation reflected from the Earth's surface. A standard camera serves as a basic example of a passive system. In agricultural surveillance, the most commonly used passive sensors are multispectral and hyperspectral imagers on satellites (like Landsat, Sentinel-2) and UAVs, which record data in several specific bands of the electromagnetic spectrum.
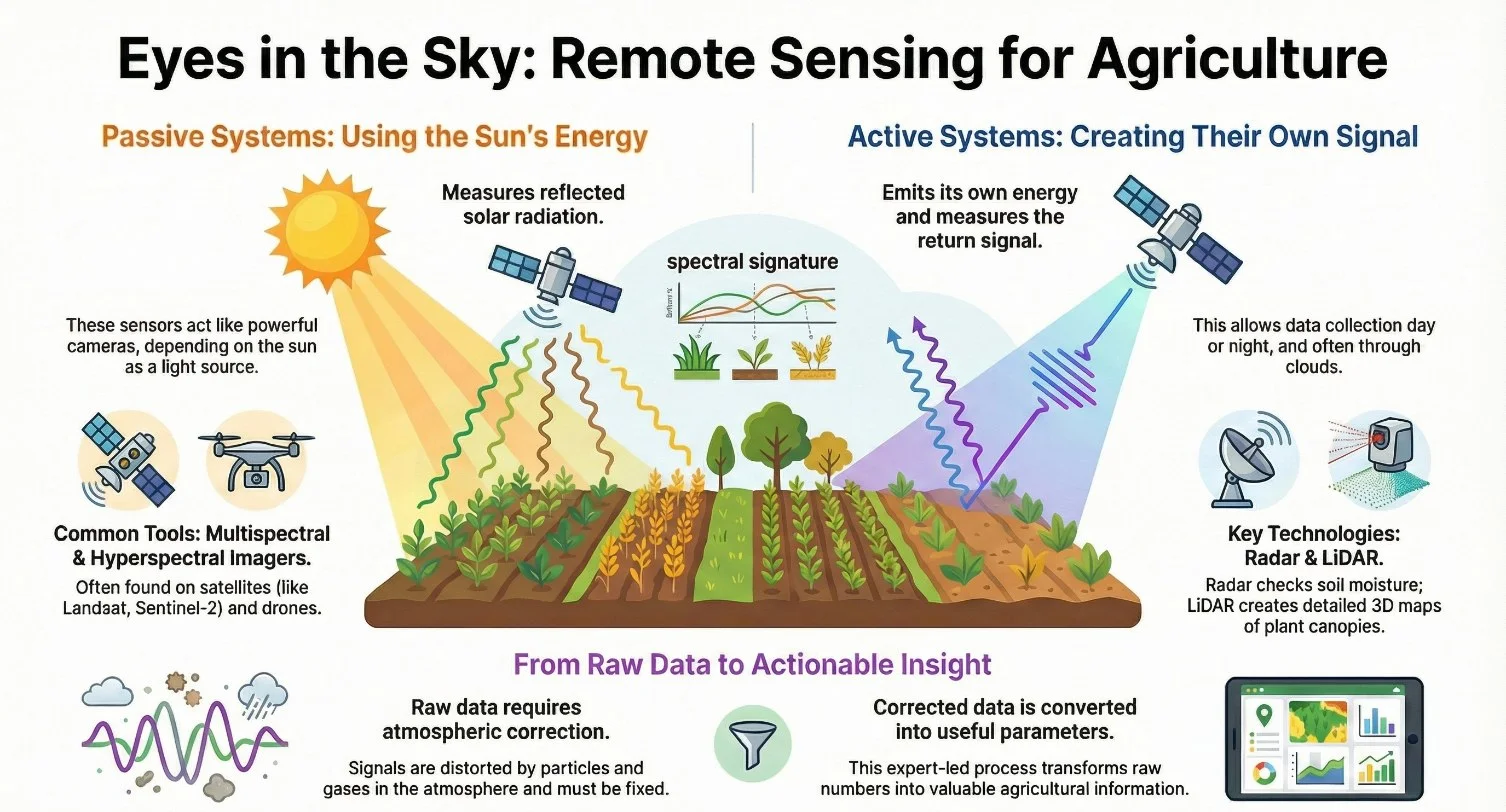
Fig. 3: Remote sensing in agriculture.
Active systems produce their own electromagnetic radiation, which they direct at a target. The sensor then measures the part of that radiation that is reflected or scattered back from the target. This method has the major benefit of being able to collect data at any time of day or night and in most weather conditions. Important active systems in agriculture include Radar (Radio Detection and Ranging), whose microwave signals can pass through clouds and even plant canopies to assess soil moisture and crop structure, and LiDAR (Light Detection and Ranging), which employs laser pulses to generate highly detailed 3D maps of the land and plant canopy. The path of electromagnetic radiation from its origin to the sensor is not without obstacles. As radiation moves through the Earth's atmosphere, it is subject to being scattered and absorbed by particles and gases.[7] These atmospheric phenomena can alter the signal the sensor receives, leading to inaccuracies in the data. Thus, a vital step in handling raw remote sensing data is atmospheric correction, which uses physical models to eliminate these distortions and obtain a precise measurement of surface reflectance.[7] This corrected data is what is used to create dependable and useful agricultural information products. The raw data, which is a set of digital numbers indicating radiance, is not directly useful. It must first be processed through these preliminary steps and then changed into significant biophysical parameters to be valuable for agricultural analysis.[8] This change from raw data to useful information is a crucial, expert-led process that comes before any use of AI models.
2.2 Platforms and sensors: a multi-scale observational arsenal
Monitoring agriculture demands data at various spatial and temporal resolutions, from the level of a single plant to entire continents. To address this requirement, a wide range of remote sensing platforms has been created, each with distinct features and uses.
Satellite Platforms: Satellites are the main tools for large-scale agricultural surveillance, offering consistent, regular, and worldwide coverage. Government-led initiatives like the NASA/USGS Landsat series and the European Space Agency's (ESA) Copernicus Sentinel missions provide freely accessible, long-term data archives that are essential for tracking climate trends and changes in land use. Missions such as the Moderate Resolution Imaging Spectroradiometer (MODIS) deliver daily global coverage, though at a lower spatial resolution, making them perfect for observing regional drought and seasonal plant dynamics.[9] The ongoing function of these satellite groups offers a historical record that goes back decades, which is crucial for comprehending the long-term effects of climate change on agricultural areas.
Unmanned Aerial Vehicles (UAVs): Also referred to as drones, UAVs have become a groundbreaking platform for precision agriculture. By flying at low altitudes, UAVs can take pictures with extremely high spatial resolution (often down to a few centimeters per pixel), offering a level of detail that is unattainable from satellites. This ability permits field-level management on an unprecedented scale, such as spotting individual stressed plants, mapping weed outbreaks with great accuracy, or checking the success of targeted fertilizer use.[10] The adaptability of UAVs also means data can be gathered as needed, letting farmers react quickly to changing situations in their fields.[11]
Ground-Based Sensors: While remote sensing offers a perspective from above, ground-based sensors supply vital on-site measurements. These encompass stationary soil moisture detectors, weather stations, and portable spectroradiometers that yield highly precise, point-specific data. This ground truth data is crucial for the calibration and verification of models developed from satellite and UAV images. By connecting the spectral data from remote sensors to direct measurements of soil and plant characteristics on the ground, researchers can create more dependable and precise algorithms for agricultural evaluation.
Choosing a platform and sensor requires a strategic balance, as there is a natural trade-off among the main features of remote sensing data: spatial, temporal, and spectral resolution. For instance, satellites like MODIS provide high temporal resolution (daily visits) but have coarse spatial resolution (250 m to 1 km), making them appropriate for regional surveillance but not for detailed field management.[12] On the other hand, high-resolution commercial satellites and UAVs offer excellent spatial detail but cover smaller areas and might have less frequent revisits or higher operational costs. This basic trade-off is a major reason for the creation of advanced methods like multi-sensor data fusion, which seek to merge the advantages of different systems to produce a more thorough and effective dataset, as shown in Table 1.
Table 1: The key features of several satellite missions that are central to contemporary agricultural monitoring.
| Mission Name | Sensor(s) | Key Spatial Resolutions (m) | Temporal Resolution (days) | Number of Spectral Bands | Key Agricultural Applications |
|---|---|---|---|---|---|
| Sentinel-1 | C-band SAR | 10, 20, 40 | 6–12 | 1 (Radar) | Soil moisture mapping, crop structure analysis, monitoring through clouds |
| Sentinel-2 | MSI | 10, 20, 60 | 2–5 | 13 | Crop type classification, vegetation health monitoring, water stress detection |
| Landsat 8/9 | OLI / TIRS-2 | 15 (Pan), 30 (MS), 100 (Thermal) | 16 | 11 | Land use change, long-term trend analysis, evapotranspiration mapping |
| MODIS | MODIS | 250, 500, 1000 | 1–2 | 36 | Regional drought monitoring, large-area yield forecasting, phenology tracking |
| PlanetScope | Dove, SuperDove | ~3 | Daily | 8 | Field-level anomaly detection, precision irrigation, damage assessment |
2.3 Key data products for agricultural assessment
Raw remote sensing data is converted into various standard products designed to measure particular characteristics of the land surface. The usefulness of these products is determined by three main features: spatial, spectral, and temporal resolution. Spatial resolution indicates the size of the smallest object that can be identified in an image, which relates to the ground area a single pixel covers. High spatial resolution (e.g., 10 m from Sentinel-2 or <1 m from UAVs) is vital for precision agriculture tasks that need detailed maps of in-field variations. Lower spatial resolution (e.g., 250 m from MODIS) is adequate for tracking trends over large areas.
Spectral resolution defines a sensor's capacity to differentiate between various light wavelengths. Multispectral sensors, like those on Landsat and Sentinel-2, record data in a few, relatively wide spectral bands (e.g., blue, green, red, near-infrared, thermal). Hyperspectral sensors, however, gather data in hundreds of very narrow, continuous bands. This high spectral detail enables the detection of slight changes in the chemical makeup of plants and soils, facilitating applications such as identifying specific nutrient shortages or spotting the initial stages of disease. Temporal resolution, or revisit frequency, is the duration it takes for a sensor to capture an image of the same spot on the Earth's surface again. High temporal resolution is essential for observing dynamic agricultural activities. For instance, the daily data from MODIS is invaluable for monitoring the swift development of a "flash drought" or for accurately recording key crop growth phases (phenology), which can happen in a very short time frame.[12]
From the adjusted spectral reflectance data, a broad array of biophysical parameters can be calculated. The most frequent and effective of these are Vegetation Indices (VIs) and Land Surface Temperature (LST). VIs are straightforward yet reliable metrics derived by mathematically combining the reflectance values of two or more spectral bands. They are formulated to amplify the spectral signal of green vegetation while reducing interference from other elements like soil brightness or atmospheric conditions. The most commonly used VI is the Normalized Difference Vegetation Index (NDVI), which is computed from the near-infrared (NIR) and red bands.[13] Healthy, thriving vegetation strongly absorbs red light for photosynthesis and reflects NIR light, leading to high NDVI values (nearing +1). In contrast, stressed vegetation or bare soil reflects more red light and less NIR, resulting in lower NDVI values. Other significant indices include the Enhanced Vegetation Index (EVI), which is less likely to saturate over thick canopies, the Soil-Adjusted Vegetation Index (SAVI), which lessens the effect of the soil background, and the Normalized Difference Water Index (NDWI), which is responsive to the water content in plant canopies. Land Surface Temperature (LST) is calculated from measurements in the thermal infrared part of the electromagnetic spectrum. LST is a crucial indicator of the surface energy balance and is very responsive to water availability. When plants have enough water, they cool down through transpiration. When they are short of water, their stomata close to save water, which makes their canopy temperature increase. Consequently, LST, especially when examined with VIs, is a potent tool for tracking drought, evaluating crop water stress, and calculating evapotranspiration rates.[13]
3. The Rise of Artificial Intelligence in Agricultural Analytics
3.1 Machine learning and deep learning: from prediction to prescription
Artificial Intelligence (AI) is a wide-ranging area of computer science centered on developing systems that can carry out tasks that usually need human intelligence, like learning, reasoning, and solving problems. In this domain, Machine Learning (ML) and its sophisticated subfield, Deep Learning (DL), have become the main drivers of the data transformation in agriculture. Machine Learning (ML) is a part of AI that concentrates on creating algorithms that can learn from and make forecasts on data without being specifically programmed for a certain task.[14] Instead of adhering to a strict set of rules, an ML model is "trained" on a vast dataset of past examples. During this training, the algorithm finds underlying patterns and connections in the data. After training, the model can use this acquired knowledge to make forecasts or classifications on new, unobserved data. This capacity to generalize from previous experience makes ML highly suitable for agricultural uses, where conditions are intricate and fluctuating.
Deep Learning (DL) is a more specialized area within ML that employs a particular kind of architecture known as an artificial neural network. What makes DL "deep" is its use of several layers of connected nodes (or "neurons"), which enables the model to learn features from the data in a structured way. For instance, when looking at an image of a crop, the first layers of a deep neural network might learn to identify basic features like edges and color. Later layers merge these basic features to learn more intricate patterns, such as textures and shapes, and even deeper layers can learn to recognize whole objects, like a sick leaf or a certain kind of weed. This ability for automatic and structured feature extraction makes DL especially effective for analyzing large, unstructured datasets like remote sensing images, where the important patterns might be too faint or complex for a person to define by hand.[10] The main objective of using these AI technologies in agriculture is to shift from conventional, uniform management methods to a data-informed, prescriptive strategy. The development of AI's function can be viewed as a move from descriptive to predictive, and then to prescriptive analysis. At first, AI models were employed for descriptive purposes like categorizing crop types or mapping soil differences.[15] The subsequent stage was predictive, utilizing historical data to forecast future results like end-of-season yield.[16] The current leading edge is prescriptive analytics, where AI systems not only foresee a problem but also suggest a particular, optimized solution, such as creating a variable-rate fertilizer map or an automated irrigation plan.[10] This change is expected to greatly improve operational effectiveness, boost profitability, and lessen the environmental effects of farming activities.[16] Nevertheless, for a farmer to rely on and follow a prescriptive suggestion from an AI, a high level of trust in the model's logic is necessary, which emphasizes the increasing significance of model transparency and clarity.[17]
3.2 Core AI applications: crop classification, yield forecasting, and stress detection
The use of AI in agriculture is extensive, but a few key areas have experienced the most notable progress and influence. These applications directly tackle the main difficulties presented by climate change, such as managing resources effectively, forecasting production results, and addressing environmental pressures.
Crop management and recognition: A basic task in agricultural surveillance is to determine what is being grown and where. AI models, especially DL classifiers, can examine satellite or aerial photos to precisely map the spatial layout of various crop types over large areas. This data is crucial for national and regional governments in agricultural planning, distributing resources, and guaranteeing food security. At the farm level, AI aids in crop management by assisting in the choice of the most appropriate crop varieties for particular environmental settings. By analyzing large datasets of genetic data, past weather trends, and soil features, ML models can pinpoint crop varieties that are more likely to be resistant to local diseases and resilient to expected climate challenges like drought or heat.[16]
Yield prediction/forecasting: Accurately predicting crop yields before the harvest is one of the most vital and beneficial uses of AI in agriculture. ML models are trained on historical data that encompasses a broad spectrum of variables, such as weather trends (temperature, rainfall), soil characteristics, management methods, and time-series of remote sensing data (e.g., vegetation indices). By understanding the intricate, non-linear connections between these elements and past yield results, the models can produce dependable forecasts for the next harvest. These predictions are extremely valuable for a variety of stakeholders: farmers can use them to make improved marketing and storage choices; insurance companies can use them to evaluate risk; and governments can use them to foresee food shortages and handle strategic reserves.
Stress and disease detection: A highly promising application of AI, particularly DL-powered computer vision, is the early identification of crop stress. DL models, especially Convolutional Neural Networks (CNNs), can be trained on extensive image collections to identify the subtle visual signs of different stressors, including nutrient shortages, water stress, pest invasions, and diseases.[10] These models can often spot these problems from high-resolution UAV or satellite images days or even weeks before the symptoms are noticeable to the human eye. This early detection capability permits prompt and focused actions, such as the accurate application of fertilizers or pesticides only to the impacted parts of a field. This method, known as precision agriculture, not only enhances the effectiveness of the treatment and reduces crop loss but also markedly cuts down on the overall use of chemical inputs, resulting in lower expenses for the farmer and a smaller environmental footprint.[10]
3.3 A survey of dominant models: from random forests to convolutional neural networks
The advancement of AI applications in agriculture has been paralleled by a development in the complexity and power of the models used. This pattern mirrors the growing accessibility of large-scale datasets and the increasing strength of computing hardware, which have facilitated a move from conventional, understandable ML algorithms to more potent but intricate DL structures.
3.3.1 Traditional machine learning models
These models are the basis for many predictive uses in agriculture and are still commonly employed, especially when handling structured, tabular data.
Linear Regression: This is one of the most basic models, used to forecast a continuous result (like crop yield) based on its linear connection with one or more input variables (like total rainfall or average temperature).[18] Although it has limitations in capturing complex relationships, it provides a helpful starting point.
Support Vector Machines (SVMs): These are strong and adaptable models that can be used for both classification (e.g., crop type) and regression (e.g., yield prediction). SVMs are especially good at handling high-dimensional data, where there are numerous input features.
Tree-Based Models: This group of models, which includes Decision Trees, Random Forests, and Gradient Boosting Machines, is very popular in agricultural analysis. A Random Forest (RF) is an "ensemble" model that functions by creating many individual decision trees during training and then providing the class that is the most common among the classes (classification) or the average prediction (regression) of the individual trees. This ensemble method makes RF very resistant to overfitting and able to manage complex, non-linear data with great accuracy. It is often seen as the "go-to" model for tasks like crop classification and yield prediction from satellite data.[16]
3.3.2 Deep learning models
These models have become the leading choice for applications that involve unstructured data, particularly images. Their capacity to learn features from the data automatically gives them a major performance edge.
Convolutional Neural Networks (CNNs): CNNs are the clear leaders in image analysis tasks. Their design is specifically tailored to process grid-like data, such as images, by using "convolutional" layers that automatically learn and identify spatial arrangements of features. This makes them extremely well-suited for analyzing remote sensing data for purposes like land cover mapping, crop classification, and spotting the visual signs of disease from aerial photos.
Recurrent Neural Networks (RNNs): In contrast to CNNs, which are made for spatial data, RNNs are designed to work with sequential data. They have an internal "memory" that lets them process sequences of inputs, making them perfect for time-series analysis. In agriculture, RNNs and their more sophisticated version, Long Short-Term Memory (LSTM) networks, are used to examine temporal patterns in data, like daily weather readings or weekly vegetation index values from satellites, to model crop growth over a season and forecast the end-of-season yield.[19]
Hybrid Models: To combine the advantages of various architectures, researchers have created hybrid models. A notable example is the CNN-LSTM model, which merges a CNN front-end for extracting spatial features from individual images in a time series with an LSTM back-end to model the temporal connections between those features. This spatio-temporal method has shown better accuracy in forecasting crop yield from sequences of satellite images.[20]
4. Synergistic Applications: Integrating Remote Sensing (RS) and AI for Climate Impact Assessment
The real groundbreaking power in contemporary agricultural surveillance comes not from Remote Sensing (RS) or Artificial Intelligence (AI) used separately, but from their combined integration. In this approach, RS functions as the main data gathering tool, supplying a constant flow of observations about the Earth's surface. AI, on the other hand, acts as the analytical core, handling this huge and intricate data to find significant patterns, create predictive insights, and convert them into practical intelligence for decision-makers. This combined workflow constitutes a full pipeline, from data collection to real-world application, and is the basis for nearly all sophisticated uses in climate-resilient agriculture. The procedure starts with gathering raw data from different platforms, mainly satellites and UAVs. This raw imagery, however, is not ready for immediate use and needs to go through several preprocessing steps to correct for atmospheric effects, geometric errors, and sensor flaws.[10] After the data is cleaned, the next important phase is feature engineering, where specialized knowledge is used to pull out relevant biophysical variables from the corrected images. This includes calculating metrics like vegetation indices (e.g., NDVI, EVI) from multispectral data or determining Land Surface Temperature (LST) from thermal bands. These engineered features, which show the health, vitality, and stress levels of plants, are the main inputs for the AI models. The AI/ML model is then trained with these features along with corresponding "ground truth" data, like historical yield data or soil moisture readings taken in the field. After thorough training and validation, the model can be used to make predictions on new data, producing outputs like detailed yield maps, water stress forecasts, or disease risk evaluations. The last, vital step is to change these model outputs into a format that is easy for the end-user to understand and act on, such as a variable-rate application map for a tractor's GPS or a straightforward irrigation warning sent to a farmer's phone. This complete process, which can be represented as a workflow diagram, illustrates how raw satellite data is gradually improved through a mix of remote sensing science and machine learning into concrete decision-support tools.
4.1 Monitoring drought and water scarcity
Evaluating and managing water availability is likely the most crucial task in helping agriculture adapt to climate change. The combination of RS and AI offers a strong, non-invasive toolkit for tracking drought and crop water stress over extensive areas. RS satellites consistently supply key data, with vegetation indices from multispectral sensors showing the effect of water stress on plant health, and LST from thermal sensors giving a direct reading of surface temperature, which increases when plants cannot cool themselves by transpiring. Although these separate data streams are useful, their real strength is shown when they are cleverly combined. One of the most successful and commonly used methods for this is the NDVI-LST feature space. This technique involves making a scatter plot of pixel values from an area, with NDVI on the x-axis and LST on the y-axis.[13] The resulting pattern of points usually creates a triangular or trapezoidal shape. The edges of this shape have significant physical interpretations: the "warm edge" indicates pixels with the highest temperature for a certain amount of vegetation, matching dry, water-scarce conditions. The "wet edge" shows pixels with the lowest temperature for a certain amount of vegetation, corresponding to well-watered conditions with maximum transpiration. The location of any single pixel in this feature space gives a solid, relative indication of its water availability. AI and statistical models use this connection to calculate quantitative measures like the Soil Moisture Index (SMI), which can be mapped to produce detailed, field-level evaluations of water stress.[13] This method is a clear example of how combining different data types — in this case, a vegetation metric and a thermal metric — can produce a much more effective indicator of crop condition than either could on its own.
Beyond tracking current situations, the merging of geospatial data and AI, often called GeoAI, is facilitating the creation of predictive drought forecasting and early warning systems. ML models, like Random Forest, can be trained to combine data from various satellite sensors (e.g., MODIS for temperature, TRMM for rainfall, SMAP for soil moisture) with climate model outputs to generate high-resolution forecasts of soil moisture and drought risk.[21] These systems permit proactive instead of reactive management, allowing water managers and farmers to make timely choices, such as changing irrigation schedules or switching to more drought-resistant crops, long before a drought's full effects are realized.[21] Additionally, AI-driven analysis of high-resolution RGB, thermal, and hyperspectral images from UAVs enables the accurate identification of water stress at the sub-field level, directing precision irrigation methods that optimize water use and increase yield.[22]
4.2 Assessing vegetation health and phenological shifts
Observing the health and growth phases (phenology) of crops is essential for evaluating agricultural output and spotting the effects of climate fluctuations. Vegetation Indices (VIs) calculated from satellite data are the main instruments for this purpose. Indices like the NDVI act as a substitute for measuring vegetation greenness and biomass, while more sophisticated metrics like the Vegetation Condition Index (VCI) and the Vegetation Health Index (VHI) offer a more detailed evaluation of vegetation health by comparing present conditions to the historical range for a particular place and time of year. The VCI adjusts the current NDVI value against its long-term minimum and maximum, effectively removing the impact of local geography and seasons to pinpoint unusual conditions that suggest stress. The VHI improves on this by adding LST data, giving a combined measure of health that considers both moisture and temperature stress. The high frequency of visits by satellites like MODIS and Sentinel-2 allows for the creation of dense time-series of these indices, enabling continuous observation of crop growth throughout the season. This temporal data is where AI models, especially those designed for sequential data like RNNs and LSTMs, are most effective. These models can examine the typical phenological curve of a crop — the pattern of greening, peak growth, and decline — and spot slight variations from the usual pattern. Such irregularities can indicate the presence of stress or, over time, point to fundamental changes in the timing of growing seasons, a key effect of climate change.[23] By learning the temporal patterns of different crops and conditions, these AI models can offer early alerts of potential issues and help to better understand how agricultural systems are reacting to a changing climate.
4.3 Predicting crop yield variability
Crop yield prediction is a key application of combined RS and AI, with major consequences for global food security, market stability, and agricultural insurance. The basic method involves using a varied set of input features, mainly from RS and weather data, to train an ML model that can accurately forecast the final yield. The input features for these models are diverse. Time-series of VIs (like NDVI) during the growing season are a primary indicator of crop health and biomass growth. LST data offers information on temperature and water stress. These RS-derived variables are usually mixed with meteorological data (e.g., rainfall, temperature, solar radiation) and static data on soil properties (e.g., texture, organic matter content).[20] The ML model, which can vary from traditional algorithms like Random Forest and Support Vector Regression to more advanced DL architectures, is trained on historical records of these features and their related final yields. Recent progress has indicated that DL models, in particular, provide better performance for this task. CNNs can automatically find relevant spatial patterns in satellite imagery that suggest yield potential, while hybrid CNN-LSTM models can handle both the spatial and temporal aspects of the data at the same time, tracking the changes in crop conditions throughout the season. These advanced models can learn the complex, non-linear relationships between environmental factors and crop growth, resulting in more precise and dependable yield forecasts.[17] The capacity to produce accurate, pre-harvest yield predictions allows for proactive planning at all levels, from a farmer managing harvest logistics to a government agency handling national food supplies in the face of climate fluctuations.
4.4 Early detection of pest and disease outbreaks
Climate change is modifying the spread and intensity of agricultural pests and diseases, presenting new difficulties for crop protection. The combination of high-resolution remote sensing and AI-driven computer vision provides a strong new defense. High-resolution images, usually taken from UAVs with multispectral or hyperspectral sensors, can detect slight changes in the spectral reflectance of plant leaves caused by the physiological stress from a pest or pathogen. These spectral changes often happen long before any symptoms, like spots or color changes, are visible to the naked eye. This is where the pattern recognition skills of DL models, especially CNNs, are crucial. These models are trained on large, labeled datasets with images of healthy plants and plants affected by different diseases and pests. Through this training, the CNN learns to spot the specific spectral and spatial signs linked to particular problems. When used, the model can analyze new images and classify plants with high accuracy, often over 95% for certain diseases. This allows for the creation of exact maps showing the location and size of an outbreak in a field. This information permits a quick and focused response, like applying pesticides precisely only to the affected areas. This targeted method not only boosts the effectiveness of the treatment and cuts crop losses but also greatly reduces the total amount of chemical inputs used, leading to significant cost savings and a smaller environmental impact of farming. The use of different sensing platforms — satellites for wide-area observation to find anomalies and UAVs for detailed examination of those anomalies — forms a layered, multi-scale monitoring system. This hierarchical method, where each platform makes up for the weaknesses of the others, is key to building a thorough and effective crop protection plan against increasing climate-related dangers.
5. Advanced Frontiers: Pushing the Boundaries of Agricultural Monitoring
In addition to the main applications, the areas of remote sensing and artificial intelligence are quickly advancing, with new methods and platforms appearing that promise to offer even more advanced, scalable, and predictive tools for agricultural surveillance. These new frontiers are aimed at overcoming the drawbacks of single-sensor systems, making planetary-scale data processing more accessible, and moving from analyzing past climate effects to accurately forecasting future weather conditions.
5.1 Multi-sensor data fusion: creating a more complete picture
No single remote sensing sensor can supply all the data required for thorough agricultural surveillance. Optical sensors give detailed spectral information but are blocked by clouds; radar can penetrate clouds but offers different data on structure and moisture; and LiDAR provides detailed 3D information but is often costly to use. Multi-sensor data fusion is an advanced method that seeks to overcome these separate limitations by cleverly merging data from several, complementary sensor types to form a single, combined dataset that is more informative and dependable than any of its individual parts.[24]
A typical example is the merging of optical and radar data. By combining the high-resolution spectral data from an optical satellite like Sentinel-2 with the all-weather imaging ability of a radar satellite like Sentinel-1, it is possible to create a continuous time-series of observations for crop monitoring, even when it is cloudy and optical data is not available. This is especially important in tropical areas where constant cloud cover can greatly reduce the usefulness of optical sensors. Data fusion can be carried out at several different levels of complexity:[24]
Pixel-level fusion means merging the raw pixel values from various sensors at the very start of processing.
Feature-level fusion, the most frequent method, involves first pulling out key features (like vegetation indices from optical data and backscatter coefficients from radar data) from each sensor separately and then using these features as inputs for a classification or prediction model.
Decision-level fusion works at the highest level of complexity, where separate decisions are made based on each data source, and then a final, unified decision is made by combining these separate outputs.
By using the complementary advantages of different sensors, data fusion is greatly enhancing the accuracy of key agricultural applications, such as crop type classification, soil property mapping, and the evaluation of plant health and water stress.
5.2 Cloud-based geospatial platforms: enabling planetary-scale analysis with Google Earth Engine
In the past, a major obstacle in remote sensing research was the practical difficulty of managing data. The huge amount of satellite imagery needed for large-area, long-term studies made analysis computationally too demanding for all but the most well-equipped institutions. This situation has been completely changed by the rise of cloud-based geospatial analysis platforms, especially Google Earth Engine (GEE). GEE is a global-scale platform that merges a multi-petabyte, constantly updated collection of publicly available satellite imagery and other geospatial datasets (including the full archives of Landsat, Sentinel, and MODIS) with a strong, parallelized cloud computing system. This groundbreaking model removes the need for users to download and keep terabytes of data on their own computers. Instead, users can create and run complex analysis algorithms directly on Google's servers through a straightforward web-based API, with the outcomes sent back to their browser in moments.[25] This has greatly opened up the field of Earth observation, allowing researchers, non-profits, and government bodies worldwide to perform analyses on a scale that was previously unthinkable.[26] GEE is now extensively used for a wide variety of agricultural purposes, from mapping cropland over entire continents and tracking deforestation in almost real-time to evaluating the regional effects of drought on food production.[27] This move from local processing to global, cloud-based platforms marks a fundamental shift in how remote sensing science is performed. While it has provided unprecedented analytical capabilities, it also creates a new reliance on a few large technology companies, posing significant long-term questions about data control, ongoing access, and the risk of algorithmic bias becoming embedded at a systemic level.[28]
5.3 AI-enhanced climate models: towards hyper-local and long-range forecasting
The use of AI in the climate field is changing significantly. While a lot of the attention has been on using AI to study the effects of weather as recorded by remote sensing data, an exciting new area involves using AI to create the next generation of weather and climate forecasting models themselves. Conventional weather prediction depends on numerical weather prediction (NWP) models, which are huge, physics-based simulations of the Earth's atmosphere. Although very accurate, these models are computationally demanding, needing massive supercomputing power to operate. This high expense and complexity have restricted their availability, especially for weather agencies in developing nations.[29] Lately, a new type of AI-driven weather model has appeared that is set to alter this situation. Models like Google's GraphCast and NeuralGCM, and Huawei's Pangu-Weather, are trained on decades of past weather data, learning the basic patterns and dynamics of the atmosphere directly from observations instead of from explicit physical laws. The outcomes have been impressive. Once trained, these AI models can produce highly accurate global forecasts at a speed that is much faster than traditional NWP models, and they can be run on a single GPU or even a powerful laptop instead of a supercomputer.[29] This technological advance is a potential game-changer for agriculture. It allows for the delivery of hyper-local, timely, and accurate weather forecasts to farmers in areas that previously did not have such capabilities. Access to dependable forecasts for temperature, rainfall, and the chance of extreme events is vital for making smart decisions about when to plant, irrigate, fertilize, or take protective actions against pests.[29] This marks a significant move up the causal chain: instead of just monitoring the agricultural effects of weather after it has happened, AI is now enabling the proactive prediction of the weather itself, offering a much more powerful tool for climate adaptation and resilience.
6. Critical Challenges and Current Limitations
Despite the groundbreaking potential of combining remote sensing and AI, the journey to widespread, effective, and fair implementation is filled with major difficulties. These obstacles are not just technical; they are closely linked to problems with data quality, model dependability, and socio-economic factors. Recognizing and tackling these limitations is crucial for directing future research and making sure that these powerful technologies fulfill their promise for everyone in the agricultural sector.
6.1 The data dilemma: heterogeneity, quality, and scarcity
The saying "garbage in, garbage out" is especially true in the context of data-driven AI. The effectiveness of even the most advanced algorithm is fundamentally limited by the quality, amount, and representativeness of the data it is trained on. In agricultural remote sensing, the data situation is full of challenges.
Heterogeneity: A main technical problem is combining data from many different sources. Merging images from various satellites, UAVs, and ground sensors needs complex harmonization processes to account for large differences in spatial resolution, temporal frequency, spectral features, and data formats. Creating a single, consistent, ready-to-use dataset from these varied sources is a difficult task that requires considerable expertise and computing power.
Quality and Availability: The quality of remote sensing data can be inconsistent. Optical satellite imagery, the most common data source, is often blocked by clouds, particularly in tropical and subtropical areas, causing large gaps in time-series data. All data is affected by atmospheric interference and needs careful calibration and correction to be trustworthy.[30]
Scarcity of Ground Truth: The most significant issue is likely the shortage of high-quality, labeled ground-truth data. AI models, especially supervised learning models, need large amounts of accurate, on-the-ground data for training and validation. For instance, a yield prediction model must be trained on thousands of examples of remote sensing features matched with actual, measured yield data from those exact locations. This ground data is often costly, time-consuming, and labor-intensive to gather.[31] As a consequence, current datasets are often small and geographically limited, leading to what is known as "data poverty" in many parts of the world, especially in developing countries and for smallholder farming systems. This shortage not only restricts model accuracy but also creates significant bias, as models are mainly trained on data from large, well-funded industrial farms in North America and Europe, making them less suitable for the varied agricultural systems found in other places.
6.2 The model transferability problem: from local success to global application
A direct result of the data scarcity and bias issue is the difficulty of model transferability, also known as generalizability. An AI model trained on data from one particular agro-climatic area often does not perform well when used in a different area. This happens because the model has learned the specific connections between environmental variables, management methods, and crop reactions that are unique to its training environment. When faced with new crop types, different soil conditions, unfamiliar climate patterns, or other farming methods, its predictive ability quickly decreases.[32] For example, a model designed to predict corn yield in the U.S. Midwest is not likely to be effective for predicting maize yield in Sub-Saharan Africa, where fields are smaller, intercropping is frequent, and climate challenges are different. This inability to transfer is a major obstacle to creating scalable, affordable solutions for global agriculture. It means that models cannot be developed once and then used everywhere; they need significant and expensive regional adjustments, fine-tuning, or complete retraining with local data to be effective. Overcoming this problem is a key focus of current research, with an emphasis on creating more robust models that can learn more basic, transferable relationships or adapt to new areas with little local data.
6.3 The "black box" issue: the need for transparency and trust
Many of the most effective and accurate AI models, especially in deep learning, operate as "black boxes." Although they can make very accurate predictions, their internal decision-making process is often unclear and hard for humans to understand.[19] A deep neural network might predict that a certain part of a field is at high risk for disease, but it cannot easily explain why it came to that conclusion. This lack of clarity is a major hurdle to adoption in a high-stakes field like agriculture.[24] Farmers, agronomists, and policymakers are understandably hesitant to base important and expensive decisions on the advice of a system whose logic they cannot comprehend or check. Trust is essential for adoption. Moreover, the black box nature of these models can hide and perpetuate hidden biases from the training data. If a model is trained on unrepresentative data, it may make consistently wrong predictions for certain groups or areas, leading to unfair or even damaging results.[33] Without transparency, finding and fixing these biases is very hard.
6.4 Practical barriers: cost, infrastructure, and scalability
In addition to the technical and data-related difficulties, a number of practical obstacles prevent the broad use of RS and AI technologies, leading to a notable "socio-technical gap." The advantages of these new technologies risk being mainly enjoyed by large, well-funded operations, which could worsen current inequalities in the global food system.
Cost and Infrastructure: The initial spending needed for sensors, UAVs, specialized software, data storage, and high-performance computing can be too high for smallholder farmers and public organizations in low-income countries.[34]
Connectivity: Many advanced agricultural technologies depend on real-time data transfer and access to cloud-based platforms. However, dependable, high-speed internet is still a major problem in many rural areas worldwide, which limits the practicality of using these systems.
Technical Expertise: Using, running, and keeping these complex systems in good working order requires special skills. There is a large global deficit of people with knowledge in agronomy, remote sensing, and data science, which creates a "digital literacy" gap that stops many potential users from making effective use of these tools.[34] This shows that successful technology use must be paired with strong efforts in education, training, and skill-building to make sure the solutions are available and usable for all involved.
7. Future Outlook: Towards Integrated, Explainable, and Actionable Systems
Tackling the significant challenges mentioned in the last section calls for a forward-thinking research plan aimed at making RS and AI systems more open, comprehensive, and useful for end-users. The future of this area is in moving past purely technical goals of predictive accuracy and toward creating integrated systems that are dependable, fair, and truly helpful for making decisions on the ground. This change points to a future where technology helps to enhance, not substitute, human knowledge, promoting a cooperative relationship between machine intelligence and the local wisdom of farmers.
7.1 Explainable AI (XAI): opening the black box for stakeholder trust
The "black box" issue is a major roadblock to the use of advanced AI models. In reaction, the field of Explainable AI (XAI) has developed with the clear aim of creating methods to make the decisions of complex models more open and understandable, without greatly reducing their predictive accuracy. XAI is not a single technique but a range of approaches created to answer the question: "Why did the model make this specific decision?" These methods can be generally grouped. Some, like LIME (Local Interpretable Model-agnostic Explanations) and SHAP (SHapley Additive exPlanations), function by clarifying individual predictions. They can, for instance, show which particular input features (e.g., high temperature in July, low NDVI in August) had the most impact on a model's decision to predict a low yield for a certain field. Other methods are made specifically for computer vision models. Grad-CAM (Gradient-weighted Class Activation Mapping), for example, creates a visual "heatmap" that can be placed over an input image, showing the exact pixels or areas of the image that a CNN concentrated on when making its classification. By offering this level of detail, XAI can change a black box prediction into a piece of information that a human expert — whether a farmer, an agronomist, or a policymaker — can carefully assess. This capacity to examine the model's logic is key to establishing trust and confidence in AI-driven advice. Additionally, XAI acts as a strong diagnostic tool for developers, helping to find hidden biases in the data or errors in the model's reasoning. The inclusion of XAI is a crucial move in advancing AI for agriculture from just a predictive tool to a dependable and trustworthy partner in decision-making.
7.2 Integration with socio-economic data: a holistic view of vulnerability and resilience
The effects of climate change are not just a result of physical exposure; they are shaped by the socio-economic situation of the people affected. A community's susceptibility to an event like a drought is determined not only by how severe the lack of rain is but also by factors such as poverty levels, access to markets, the availability of irrigation systems, and social support networks. To create truly effective and fair adaptation plans, it is therefore crucial to go beyond just environmental monitoring and combine remote sensing data with socio-economic data. This combination allows for a more complete and detailed understanding of agricultural systems and their weaknesses. Organizations like NASA's Socioeconomic Data and Applications Center (SEDAC) are key in this effort by creating and sharing global, gridded datasets on important socio-economic factors like population density, poverty levels, infrastructure, and market access. When these datasets are merged with RS-derived data on climate risks (e.g., drought maps) and agricultural output (e.g., yield maps), it is possible to carry out thorough vulnerability studies. For instance, analysts can pinpoint "hotspots" that are not only facing severe climate stress but are also inhabited by people with low ability to adapt.[35] This comprehensive view is vital for directing interventions, distributing resources more efficiently, and creating policies that tackle the fundamental causes of vulnerability, making sure that climate adaptation measures support those who are most in need.
7.3 Developing localized Climate-Smart Decision-Support Systems (DSS)
The true measure of success for these advanced technologies is their capacity to provide real advantages to farmers. This means turning complex data and models into useful, easy-to-access, and localized Decision-Support Systems (DSS). The main framework for creating these systems is increasingly Climate-Smart Agriculture (CSA), a combined approach that aims to achieve three related goals at the same time: sustainably boosting agricultural productivity, improving the resilience of farming systems (adaptation), and cutting down on greenhouse gas emissions when possible (mitigation). Effective DSS cannot be a single solution for everyone. They must be specifically designed for the particular agro-ecological, climatic, and socio-economic situation where they will be used.[36] A DSS for a small-scale maize farmer in a semi-dry area of Africa will have very different needs from one made for a large commercial wheat farmer in a temperate region. The creation of these tools must therefore be a collaborative effort, developed with farmers, extension workers, and other local stakeholders to make sure the information given is relevant, timely, and practical in their specific working conditions. These systems are designed to offer very local advice, using real-time data from in-field sensors and high-resolution remote sensing, along with AI-improved weather forecasts, to provide direction on key management choices.[26] This could include suggestions on the best planting times, exact irrigation schedules, variable-rate fertilizer use, or early alerts of pest and disease dangers. By incorporating advanced science into simple-to-use tools, these localized DSS form the final, crucial connection in the process from global satellite data to better local results, enabling farmers to create more productive, sustainable, and resilient agricultural systems. This development shows a wider change in how success is evaluated — moving from just predictive accuracy to a more complete assessment that includes transparency, fairness, usability, and real-world impact.
8. Conclusion
The combination of climate change and increasing global food needs has put immense strain on the world's farming systems. This review has brought together a wide range of research showing the groundbreaking potential of merging Remote Sensing (RS) and Artificial Intelligence (AI) to tackle this major issue. RS offers an unmatched ability for large-scale, ongoing surveillance of agricultural areas, supplying vital data on plant health, water levels, and soil states. AI, in turn, provides the analytical strength to process this huge flow of data into predictive insights and practical intelligence. Their combined effect is creating a major shift towards a more accurate, data-informed, and adaptable type of agriculture, with proven success in areas from crop yield forecasting and drought surveillance to the early spotting of pests and diseases. New developments like multi-sensor data fusion, cloud-based platforms such as Google Earth Engine, and AI-improved climate models are pushing the limits of what can be achieved, allowing for more dependable analyses on a global scale and offering proactive, very local forecasts. These technologies are no longer just ideas; they are becoming mature instruments that are the basis of modern climate-smart agriculture.
However, the journey to using this potential globally is limited by major and varied difficulties. The dependability of AI models is fundamentally restricted by the supply of high-quality, representative training data — a resource that is still limited and not fairly distributed. The difficulty of transferring models across different agro-climatic areas prevents the creation of scalable solutions. Furthermore, the "black box" aspect of many advanced algorithms creates a trust issue, while practical problems related to cost, infrastructure, and technical knowledge restrict access for the most at-risk farming communities. These difficulties highlight a key fact: technological progress by itself is not enough.
The future of this area, therefore, must be shaped by a united effort to create systems that are not only precise but also open, fair, and practical. The move towards Explainable AI (XAI) is a crucial step in clarifying the black box, building the trust needed for broad use. The inclusion of socio-economic data is vital for moving from just biophysical monitoring to a complete understanding of vulnerability, making sure that actions are effectively targeted. In the end, the aim must be the joint creation of localized, climate-smart decision-support systems that provide farmers with timely, relevant, and usable information, enhancing their knowledge rather than trying to substitute it. To set a course for a truly climate-resilient agricultural future, a two-fold commitment is needed. Researchers and technologists must keep innovating, creating more robust, transferable, and understandable models. At the same time, policymakers, development organizations, and the private sector must invest in the essential foundations of data infrastructure, digital skills, and collaborative design. By closing the divide between advanced science and real-world conditions, the powerful combination of remote sensing and artificial intelligence can be used to help ensure a sustainable and food-secure future for a world facing a changing climate.
Acknowledgment
We sincerely thank the School of Sciences, P P Savani University, Kosamba, Surat, Gujarat, India, for providing the academic resources and infrastructure that enabled the completion of this work. We are deeply grateful to our mentors, colleagues, and reviewers for their invaluable guidance, constructive feedback, and insightful suggestions, which significantly enhanced the quality of this manuscript. Our thanks also extend to the researchers whose work we have cited, as their contributions formed the foundation of this work. Finally, we express our heartfelt appreciation to our families for their unwavering support and encouragement throughout this research.
Funding Declaration
This research did not receive any specific grant from funding agencies in the public, commercial, or not-for-profit sectors.
Data Availability Statement
The datasets generated and/or analyzed during the current study that support the findings are available from the corresponding author upon reasonable request.
Conflict of Interest
There is no conflict of interest.
Artificial Intelligence (AI) Use Disclosure
The authors declare that artificial intelligence (AI)-assisted tools were used only for language refinement, grammar improvement, and manuscript structuring purposes during the preparation of this work. All technical content, experimental implementation, results, and interpretations were independently developed and verified by the authors.
Supporting Information
Not applicable.
References
- [01] N. Kazanskiy, R. Khabibullin, A. Nikonorov, S. Khonina, A comprehensive review of remote sensing and artificial intelligence integration: advances, applications, and challenges, Sensors, 2025, 25, 5965, doi: 10.3390/s25195965.
- [02] Y. Pramudya, Komariah, W. S. Dewi, Sumani, Mujiyo, T. A. Sukoco, Z. Rozaki, Remote sensing for estimating agricultural land use change as the impact of climate change, Proceedings of Land Surface and Cryosphere Remote Sensing III, SPIE Asia-Pacific Remote Sensing, New Delhi, India, 2016, 9877, 987720, doi: 10.1117/12.2223878.
- [03] M. Saifuzzaman, V. Adamchuk, H-H. Huang, W. Ji, N. Rabe, A. Biswas, Data clustering tools for understanding spatial heterogeneity in crop production by integrating proximal soil sensing and remote sensing data, International Conference on Precision Agriculture (ICPA), Montreal, Canada, 2018.
- [04] C. Sangeetha, V. Moond, Rajesh G. M., J. S. Damor, S. K. Pandey, P. Kumar, B. Singh, Remote sensing and geographic information systems for precision agriculture: a review, International Journal of Environment and Climate Change, 2024, 14, 287– 309, doi: 10.9734/ijecc/2024/v14i23945.
- [05] G. Sweet, Google’s AI supporting farmers through climate change, available at https://sustainabilitymag.com/news/how-googles-ai-weather-model-helps-38-million-farmers, 2025.
- [06] S. O. Araújo, R. S. Peres, J. C. Ramalho, F. Lidon, J. Barata, Machine learning applications in agriculture: current trends, challenges, and future perspectives, Agronomy, 2023, 13, 2976, doi: 10.3390/agronomy13122976.
- [07] D. G. Pai, M. Balachandra, R. Kamath, Explainable AI in agriculture: review of applications, methodologies, and future directions, Engineering Research Express, 2025, 7, 032202, doi: 10.1088/2631-8695/ae086a.
- [08] Climate change cuts global crop yields, even when farmers adapt, Stanford Doerr School of Sustainability, 2025, available at: https://sustainability.stanford.edu/news/climate-change-cuts-global-crop-yields-even-when-farmers-adapt.
- [09] Earth Science Data Systems, N. Vegetation Index, NASA Earth data, 2024, available at https://www.earthdata.nasa.gov/topics/biosphere/vegetation-index.
- [10] A. S. A. Nugraha, M. Kamal, S. Heru Murti, W. Widyatmanti, Accuracy assessment of land surface temperature retrievals from remote sensing imagery: pixel-based, single and multi-channel methods, Geomatics, Natural Hazards and Risk, 2024, 15, 2324975, doi: 10.1080/19475705.2024.2324975.
- [11] S. K. Filippelli, K. Schleeweis, M. D. Nelson, P. A. Fekety, J. C. Vogeler, Testing temporal transferability of remote sensing models for large area monitoring, Science of Remote Sensing, 2024, 9, 100119, doi: 10.1016/j.srs.2024.100119.
- [12] R. Acharya, K. Samanta, K. N. Haque, S. Box, S. Sengupta, P. Bhattacharya, S. Kanthal, Climate change impact on soil health and crop production, International Journal of Research in Agronomy, 2024, 7, 150-156, doi: 10.33545/2618060X.2024.v7.i4c.540.
- [13] Y. Huang, Z. Chen, T. Yu, X. Huang, X. Gu, Agricultural remote sensing big data: Management and applications, Journal of Integrative Agriculture, 2028, 17, 1915–1931, doi: 10.1016/S2095-3119(17)61859-8.
- [14] R. Lottering, K. Peerbhay, S. Adelabu, Remote sensing applications in agricultural, earth and environmental sciences, Applied Sciences, 2025, 15, 4537, doi: 10.3390/app15084537.
- [15] W. Wetzel, The role of explainable AI in agriculture, Spectroscopy Online, 2025, https://www.spectroscopyonline.com/view/the-role-of-explainable-ai-in-agriculture.
- [16] R. Lottering, K. Peerbhay, S. Adelabu, Remote sensing applications in agricultural, earth and environmental sciences, Applied Sciences, 2025, 15, 4537, doi: 10.3390/app15084537.
- [17] A. Kumar, I. Singh, M. Kashyap, A. Kumar, N. B. Devi, S. Singh, S. Sharma, R. Pradhan Integration of machine learning and remote sensing in crop yield prediction: A review, International Journal of Research in Agronomy, 2025, 8, 549–562, doi: 10.33545/2618060X.2025.v8.i1Sh.2496.
- [18] M. F. Aslan, K. Sabanci, B. Aslan, Artificial intelligence techniques in crop yield estimation based on sentinel-2 data: a comprehensive survey, Sustainability, 2024, 16, 8277, doi: 10.3390/su16188277.
- [19] B. Chhatria, S. Panda, S. Kumar Tarai, H. Dharua, S. Naik, Impacts of climate change on crop yield variability and marginality: assessing vulnerabilities and adaptive strategies, International Journal of Research and Review, 2025, 12, 267-277, doi: 10.52403/ijrr.20250530.
- [20] A. J. Atapattu, L. Perera, T. Nuwarapaksha, S. S. Udumann, N. Dissanayaka, Challenges in achieving artificial intelligence in agriculture, In: Chouhan, S.S., Saxena, A., Singh, U.P., Jain, S. (eds) Artificial Intelligence Techniques in Smart Agriculture. Springer, Singapore, doi: 10.1007/978-981-97-5878-4_2.
- [21] Introduction to Remote Sensing, https://agricdemy.com/post/remote-sensing-introduction, Accessed 15 September 2025.
- [22] Prism Sustainability Directory, AI-driven predictive models for climate-resilient agriculture, https://prism.sustainability-directory.com/scenario/ai-driven-predictive-models-for-climate-resilient-agriculture/, Accessed 20 September 2025.
- [23] V. Vani, P. Kummamuru, V. Mandla, Agriculture drought analysis using remote sensing based on NDVI-LST feature space, Indian Journal of Ecology, 2028, 45, 6–10.
- [24] M. Habib-ur-Rahman, A. Ahmad, A. Ahmad, A. Raza, M. Usama Hasnain, H. F. Alharby Hesham, Y. M. Alzahrani, A. A. Bamagoos, K. R. Hakeem, Saeed Ahmad, W. Nasim, S. Ali, F. Mansour, A. EL. Sabagh, Impact of climate change on agricultural production; issues, challenges, and opportunities in Asia, Frontier in Plant Science, 2022, 13, doi: 10.3389/fpls.2022.925548.
- [25] F. Samadzadegan, A. Toosi, F. Dadrass Javan, A critical review on multi-sensor and multi-platform remote sensing data fusion approaches: current status and prospects, International Journal of Remote Sensing, 2025, 46, 1327-1402, doi: 10.1080/01431161.2024.2429784.
- [26] Climate smart farming, Cornell Climate Stewards, https://climatestewards.cornell.edu/climate-smart-farming, 2018, Accessed 25 September 2025.
- [27] K. Tang, H. Zhu, P. Ni, Spatial downscaling of land surface temperature over heterogeneous regions using random forest regression considering spatial features, Remote Sensing, 2021, 13, 3645, doi: 10.3390/rs13183645.
- [28] S. B. Cho, H. M. Soleh, J. W. Choi, W.-H. Hwang, H. Lee, Y.-S. Cho, B. K. Cho, B.-K., Kim, M. S., Baek, I., & Kim, G. (2024). Recent Methods for Evaluating Crop Water Stress Using AI Techniques: A Review. Sensors, 2024, 24, 6313. https://doi.org/10.3390/s24196313.
- [29] V. Solanky, S. Singh, S. K. Katiyar, Land surface temperature estimation using remote sensing data, In: Singh, V., Yadav, S., Yadava, R. (eds) Hydrologic Modeling. Water Science and Technology Library, 81. Springer, Singapore. doi: 10.1007/978-981-10-5801-1_24.
- [30] Robotics and AI: Remote Sensing. UK Agri-Tech Centre, https://ukagritechcentre.com/capability/robotics-and-ai-remote-sensing/, Accessed 22 September 2025.
- [31] D. Cho, D. Bae, C. Yoo, J. Im, Y. Lee, S. Lee, All-sky 1 km MODIS land surface temperature reconstruction considering cloud effects based on machine learning, Remote Sensing, 2022, 14, 1815, doi: 10.3390/rs14081815.
- [32] S. Saha, O. D. Kucher, A. O. Utkina, N. Y. Rebouh, Precision agriculture for improving crop yield predictions: a literature review, Frontiers in Agronomy, 2025, 7, doi: 10.3389/fagro.2025.1566201.
- [33] US EPA, O. Climate change impacts on agriculture and food supply, 2022, https://www.epa.gov/climateimpacts/climate-change-impacts-agriculture-and-food-supply, Accessed 23 September 2025.
- [34] D. Radočaj, J. Obhođaš, M. Jurišić, M. Gašparović, Global open data remote sensing satellite missions for land monitoring and conservation: a review, Land, 2020, 9, 402, doi: 10.3390/land9110402.
- [35] N. Sanders, Soil moisture: challenges, trends and AI, 2025, available at https://research.reading.ac.uk/lemontree/soil-moisture-challenges-trends-and-ai/, Accessed 28 September 2025.
- [36] M. Keskes, Review of the current state of deep learning applications in agriculture, 2025, doi: 10.31219/osf.io/xg4rs_v2.
Publisher Note: The views, statements, and data in all publications solely belong to the authors and contributors. GR Scholastic is not responsible for any injury resulting from the ideas, methods, or products mentioned. GR Scholastic remains neutral regarding jurisdictional claims in published maps and institutional affiliations.
Open Access
This article is licensed under a Creative Commons Attribution-NonCommercial 4.0 International License, which permits the non-commercial use, sharing, adaptation, distribution and reproduction in any medium or format, as long as appropriate credit to the original author(s) and the source is given by providing a link to the Creative Commons License and changes need to be indicated if there are any. The images or other third-party material in this article are included in the article's Creative Commons License, unless indicated otherwise in a credit line to the material. If material is not included in the article's Creative Commons License and your intended use is not permitted by statutory regulation or exceeds the permitted use, you will need to obtain permission directly from the copyright holder. To view a copy of this License, visit: https://creativecommons.org/licenses/by-nc/4.0/
© The Author(s) 2025