

 Open Access||Research Article
Peace, Sustainability, and War: An Explainable Graph-AI Framework for Quantifying Model-Based Peace Dividends
Md Sarwar Kamal1 , Sonia Farhana Nimmy2
1 Melbourne Polytechnic Melbourne, VIC, 3072, Australia
2 School of System and Computing, University of New South Wales, Canberra, ACT, Australia
Abstract
Public Armed conflict can disrupt institutions, public services, investment, food systems, energy transitions, and environmental planning, whereas more peaceful conditions can create additional capacity for long-horizon sustainability action. Existing conflict, governance, development, energy, and Sustainable Development Goal (SDG) datasets are usually analysed as separate tables, which limits direct representation of temporal persistence and regional context. This research introduces a reproducible explainable graph-artificial-intelligence framework that represents each unit-year observation as a node and derives relational information from temporal and regional peer links. The current implementation combines graph-enriched features with classification, regression, SHapley Additive exPlanations (SHAP), chronological validation, and a non-causal peace-dividend scenario engine. Methodological validation uses 960 synthetic unit-year records representing 80 artificial units from 2012–2023; no real country or conflict is ranked. Training uses 2012–2019, validation uses 2020–2021, and final testing uses 2022–2023. On the held-out years, the graph-enriched random forest obtains an area under the receiver operating characteristic curve (AUC) of 0.972 (95% bootstrap interval: 0.946–0.991), an F1-score of 0.837, a mean absolute error (MAE) of 3.68, and R2 = 0.887. A linear node-only benchmark reaches similar AUC and lower regression error because the synthetic generator contains a strong additive signal; therefore, relational complexity is not presented as automatically superior. SHAP attribution assigns 89.3% of aggregate importance to contemporaneous node attributes, 9.5% to temporal context, and 1.2% to regional context. In a model-response scenario, a 30-point peace perturbation increases the mean predicted sustainability score from 52.41 to 58.68 and the mean predicted low-risk probability from 32.6% to 46.0%. These values are synthetic model responses rather than causal effects. The contribution is a transparent graph-aware workflow that separates prediction, explanation, scenario analysis, uncertainty, and responsible interpretation.
Keywords
Graphical Abstract
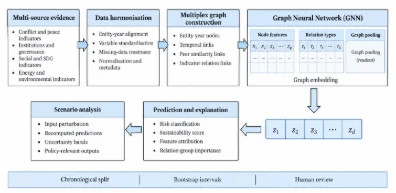
Novelty Statement
An explainable graph-AI framework integrates temporal and regional relationships to model sustainability risks and assess non-causal peace-dividend scenarios transparently.