

 Open Access||Research Article
Energy-Constrained AI Inference and Legacy Hardware Optimization for Sustainable ICT Energy Footprint Management

Department of Computer Engineering, Vishwakarma Institute of Technology, Pune, Maharashtra, 411037, India
Abstract
The rapid growth of generative AI has disrupted the conventional energy trends of data centers, resulting in sudden energy spikes and accelerating hardware replacement cycles. Although the industry's standard approach involves instant updates for new accelerators, such an approach results in essential environmental oversight because of the failure to consider manufacturing emissions. In this paper, we propose an energy-aware, software-oriented architecture to limit the energy consumption of local infrastructure and prolong the lifetime of legacy enterprise hardware. With the help of request-based model cascades and an emergency load-based admission control module, we are able to decrease the complexity of the models and the accuracy of their inference at times of increased loads. The efficiency of the proposed system is demonstrated through trace-driven numerical experiments using the real-world Alibaba Cluster Trace. Moreover, life cycle optimization modeling shows that retaining legacy hardware yields lower net lifecycle carbon emissions than premature replacement does on grids with abundant renewables.
Keywords
Graphical Abstract
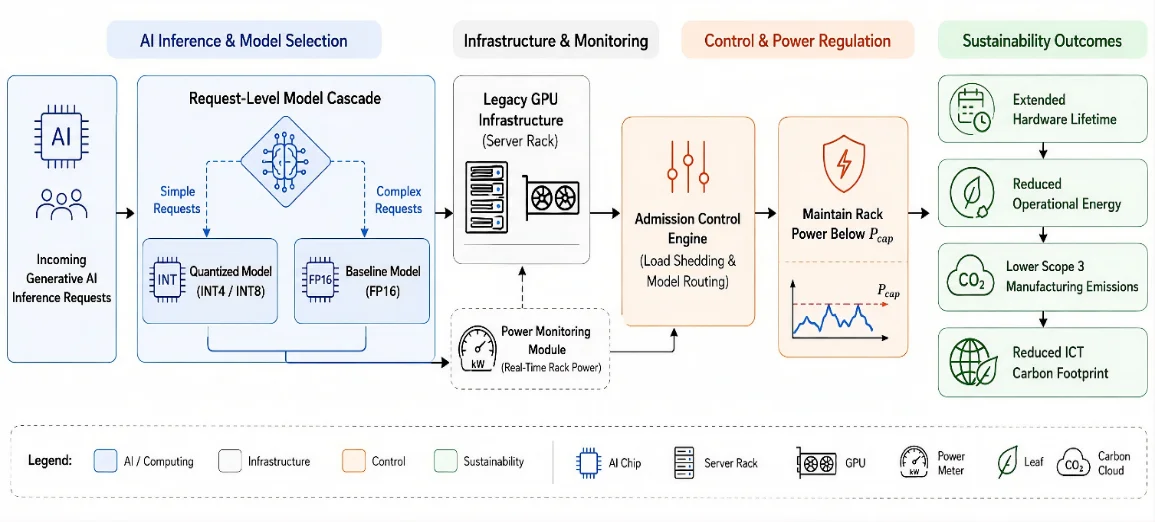
Novelty Statement
Unlike conventional data center upgrades that ignore manufacturing emissions, this paper introduces a novel software architecture that dynamically lowers model complexity and accuracy during peak loads using request-based cascades and emergency admission control. Its primary novelty lies in proving that retaining legacy enterprise hardware on renewable-heavy grids yields significantly lower net lifecycle carbon emissions than the industry-standard practice of immediate, premature accelerator upgrades.
1. Introduction
Over the past decade, the information and communication technology (ICT) industry has been able to effectively minimize environmental impact through aggressive infrastructural consolidation. The number of cloud computing instances and amounts of data increased more than fivefold between 2010 and 2018, whereas the overall energy usage of data centers demonstrated a negligible dependence on the growth factor and increased by only 6%.[1] This stability was possible because of the relocation of the IT workload into the hyperscale data centers, which were optimized to achieve maximum performance through the server virtualization and facilities’ power consumption. However, the rise of generative artificial intelligence and large language models (LLMs) represents a fundamental challenge to this sustainability equation.[2] This pattern mirrors the Jevons paradox: as algorithmic efficiency improved and the marginal cost of computation decreased, computing became more accessible, and aggregate demand expanded, ultimately exceeding any local efficiency gains. As a consequence of such workloads, enterprise data center operators are forced to follow a strategy of hyper-accelerated obsolescence of the infrastructure and retire functional pieces of hardware such as legacy enterprise graphics processing units (GPUs) for cutting-edge high-density AI accelerators. This represents a serious environmental issue since the ICT industry pays attention solely to the operational energy consumption and efficiency of the power grid without considering the colossal Scope 3 embodied carbon footprint of semiconductor fabrication.[3]
Existing efforts to address these pressures largely treat query-level efficiency and infrastructure-level power management as separate problems. Model cascading and dynamic routing frameworks[4–6] optimize for inference cost, latency, or accuracy trade-offs at the level of an individual query but do not couple these decisions to a hard physical power ceiling at the rack or facility level. Conversely, carbon- and power-aware frameworks operate at the opposite end of the stack. Storage-layer optimizations such as AdaCache mitigate cloud workload pressure through block-level data management rather than inference-time computation. Grid-facing dispatchers such as Radovanović et al. shift the timing or location of entire batch workloads in response to grid-level carbon intensity but do not intervene in real time on individual, sub-second inference requests. Neither class of approach dynamically links per-request semantic routing decisions to a hard infrastructure power constraint nor uses precision degradation (from 16-bit floating point, FP16, through 8-bit integer, INT8, to 4-bit integer, INT4) as a real-time localized safeguard against rack-level PDU failure. The novelty of the present work lies precisely in this codesign: a microlayer request cascade and a macro-layer admission control engine operate jointly and are both mathematically governed by a forward-looking, lifecycle carbon-payback model that is explicitly optimized for extending the operational lifespan of legacy enterprise hardware, rather than treating power management and hardware retirement as independent decisions. Retirement of functional hardware in exchange for newly manufactured accelerators creates carbon debt, which will take years to be compensated depending on the carbon intensity of the local energy grid. Therefore, to address this contradiction, this paper offers a software-based architecture design that minimizes the local infrastructure’s energy consumption while extending the lifespan of the hardware deployed at data centers. The validation of the proposed architecture design via trace-driven numerical simulation aligned with modern compliance standards reveals that algorithmic intelligence is able to provide sustainability for the local infrastructure, as maintenance of legacy hardware results in a net-negative carbon lifecycle compared with the accelerated hardware replacement schedule.[7]
2. Methods/Experimental Details
2.1 System Architecture and Hardware Telemetry
The baseline of the system is defined using a server rack containing NVIDIA V100 enterprise GPUs as the legacy node versus a modern alternative in the form of high-density NVIDIA H100 Tensor Core accelerators. Power usage profiles will be derived on the basis of multitenant cluster deployment attributes and architectural carbon footprints.[7,8] The initial operational boundaries are set by the thermal design power (TDP) of the corresponding accelerator nodes, with legacy hardware operating at TDPlegacy = 300 W and modern hardware operating at TDPnew = 700 W. Rack power is constrained by the hard upper cap, Pcap, of the localized power distribution unit (PDU):
(1) Prack(t) ≤ Pcap
where Prack(t) is the instantaneous power consumption of the cluster at time t.
To account for actual workload execution, normalized throughputs measured on the basis of the standardized machine learning performance (MLPerf) inference benchmark suite (MLCommons) are incorporated. Let the legacy and new inference processing rates be denoted by Rlegacy and Rnew, respectively. The operational energy consumption per 10,000 processed queries (W, measured in kilowatt hours) is formally defined as:
(2) Wlegacy = TDPlegacy / Rlegacy
(3) Wnew = TDPnew / Rnew
The overall architecture of the proposed energy-aware AI inference framework, showing the request-level model’s cascading, admission control, and legacy GPU infrastructure, is given in Fig. 1.
Fig. 1. System architecture of the proposed energy-aware AI inference framework.
2.2 Formal Control Laws
Without exceeding Pcap, a two-layer controller is built into the software layer.
Mechanism 1: Request-level model cascade (microlayer)
Every inference request x is evaluated using existing models for neural network query optimization and dynamic model routing schemes.[4,5] The cascade calculates the complexity of the prompt on the basis of the token-length and linguistic heuristics classifier. Basic queries are redirected to the highly localized, compressed model with low precision (INT4/INT8) on the legacy nodes, while the unquantized, massive model pipeline is used exclusively for the complex logical paths. The routing function f(x):
(4) f(x) = Mquantized if score(x) < τ, else Mbaseline
where score(x) is the heuristic complexity score of the request and τ is the routing threshold coefficient.
The heuristic complexity score is computed as a weighted combination of two signals: a normalized input token length, contributing 60% of the score, and a syntactic/keyword feature score, contributing the remaining 40%, which flags the presence of multistep reasoning indicators and code syntax within the prompt. The routing threshold coefficient was held fixed at τ = 0.45 throughout all the experiments. Quantized inference (FP16→INT8→INT4) is realized in practice using the BitsAndBytes library integrated with the Hugging Face Transformers framework, which supports on-the-fly precision switching without reloading model weights.
Mechanism 2: Admission control engine (Macro-Layer)
In contrast to the continuously working cascade, the admission control engine is a system that is inactive under normal cluster operation. If the aggregate demand surge causes the instantaneous rack power consumption Prack(t) closer to a critical activation level (θ·Pcap), the controller overrides the default execution parameters and decreases the inference precision of all racks by one precision tier (e.g., FP16 to INT8 or INT8 to INT4). The control law for such degradation:
(5) if Prack(t) ≥ θ·Pcap then degrade precision tier
where θ represents the target safety buffer coefficient, empirically fixed to 0.85. The admission controller reevaluates Prack(t) against θ·Pcap at a fixed polling interval of Δt = 1 s. To prevent oscillation between precision tiers under fluctuating load, the controller applies a hysteresis band of δ = 0.05 around the activation threshold and restores baseline precision only after the measured power remains below the threshold for five consecutive polling intervals (a 5 s cooldown).
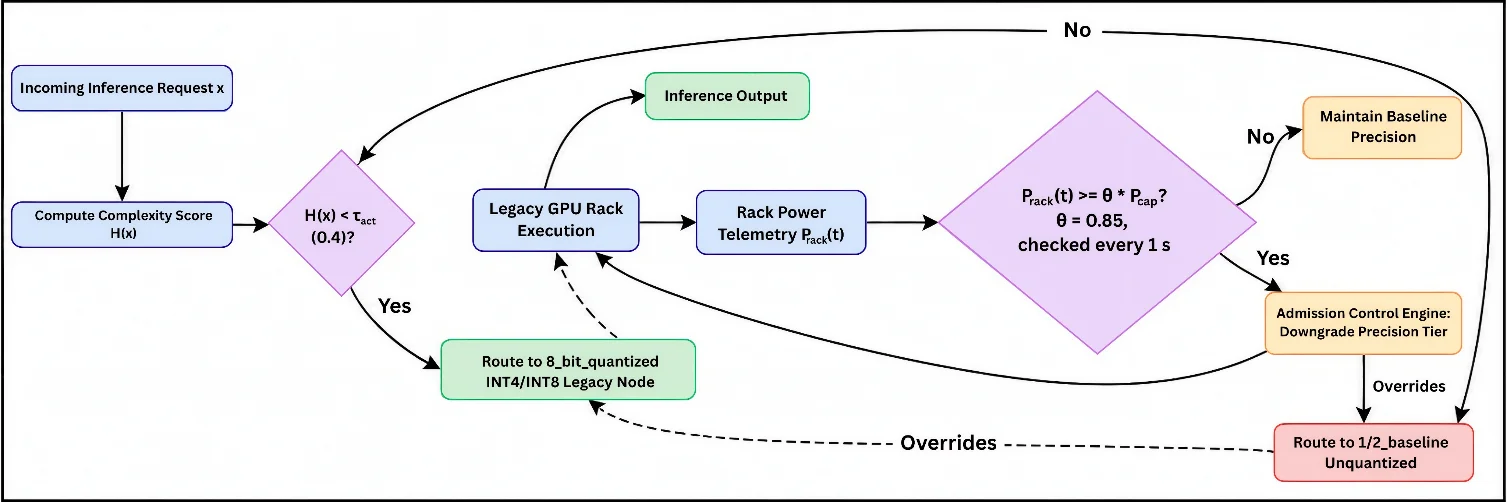
Fig. 2. Decision workflow for complexity-aware inference routing and power-constrained precision adaptation.
Algorithm 1: Request-Level Model Cascade (Micro-Layer)
Input: incoming request x
1:  token_len ← Normalize(TokenLength(x))
2:  syntax_score ← SyntacticKeywordScore(x)     // detects multistep reasoning cues and code syntax
3:  score ← 0.6 × token_len + 0.4 × syntax_score
4:  if score < τ then                            // τ = 0.45
5:    selected_model ← M_quantized               // INT4/INT8, legacy node
6:  else
7:    selected_model ← M_baseline                // unquantized
8:  end if
9:  return Execute(selected_model, x)
Algorithm 2: Admission Control Engine (Macro-Layer)
Input: P_cap, θ = 0.85, Δt = 1 s
1:  current_tier ← Baseline
2:  loop every Δt:
3:    measure P_rack(t)
4:    if P_rack(t) ≥ θ · P_cap then
5:      current_tier ← Downgrade(current_tier)  // Baseline → INT8 → INT4
6:      apply current_tier to all active inference requests, overriding Algorithm 1
7:    else
8:      current_tier ← Baseline
9:      restore full-precision execution
10:   end if
11: end loop
2.3 Life Cycle Optimization and the Carbon Breakeven Model
The optimization is formulated as a carbon payback period model, structurally analogous to existing approaches used in the embodied-carbon lifecycle assessment literature. Manufacturing emissions (Efab) are calculated using the state-of-the-art Architectural Carbon Tool (ACT) and denote the initial carbon debt that must be repaid as part of the process of manufacturing a new accelerator, regardless of future use.[3] Given the throughput-normalized operational energy requirements Wlegacy and Wnew (Section 2.1), the breakeven condition using the regional grid carbon intensity factor, CIF:
(6) Efab = (Wlegacy − Wnew) × CIF × Qbreak
(7) Qbreak = Efab / [(Wlegacy − Wnew) × CIF]
(8) Tbreak = Qbreak / λ (where λ = mean workload arrival rate in query blocks per hour)
Expressing Qbreak in units of time via Equation 8 serves two purposes. First, it converts the breakeven volume into an operationally meaningful duration: how many months of legacy-hardware workload are required to repay the carbon debt of a new accelerator? Second, it establishes a validation bound against the hardware’s industrial service life (L, 3–5 years): the single-cycle model applies only when Tbreak ≤ L. If Tbreak > L, the payback spans more than one replacement generation and requires multigeneration modeling.
2.4 Trace-Driven Simulation Setup and Performance Metrics
The architecture is proven via trace-based numerical simulations using the actual Alibaba Cluster Trace dataset, called ClusterData2022.[10] The simulator is implemented in Python as a custom discrete-event execution loop, using NumPy and Pandas for vectorized trace ingestion and time series telemetry computation. Request arrivals are sampled directly from ClusterData2022 timestamps by translating normalized CPU and memory resource-utilization peaks into proportional token arrival frequencies. Prompt complexity scores for each simulated request are assigned by sampling from a bounded beta distribution fitted to the historical job duration statistics of the trace.
Three baselines are introduced:
- Baseline A (Uncontrolled Legacy): Maintaining the legacy hardware setup while allowing incoming requests to surge and increase the power draw of the system uncontrollably.
- Baseline B (Immediate Replacement): The hardware is replaced instantaneously while accounting for the embodied carbon cost incurred immediately as soon as the new accelerators arrive.
- Proposed System (Controlled Legacy): Deploying both the Model Cascade and Admission Control on the existing legacy hardware rack.
All carbon measurements are recorded according to the Software Carbon Intensity (SCI) standard of the Green Software Foundation per unit of work (in 10,000 queries).[11]
2.5 Hardware Emulation Validation Testbed
To complement the trace-driven numerical simulation, the control architecture was additionally deployed and evaluated on a real hardware testbed. The testbed consists of a personal laptop equipped with a consumer-tier NVIDIA GeForce RTX 4060 laptop GPU (8 GB VRAM) with hardware tensor core support, serving as a scaled-down, single-node analog of the legacy enterprise rack. The software engine combines Hugging Face Transformers with the BitsAndBytes library to perform dynamic, on-the-fly precision switching (FP16→INT8→INT4) on a Llama-3-8B-Instruct model. The workload input is a highly volatile 2-hour peak-stress subset extracted from ClusterData2022. All emulation metrics reported in Section 3.3 are averaged across 5 repeated trials.
Operational constants: τ = 0.45, θ = 0.85, δ = 0.05, Δt = 1 s, with a five-interval precision-restore cooldown. Per-request complexity scores drawn from beta distribution with shape parameters α = 2.1 and β = 5.4. Evaluation workload: trace window seconds 32,400 to 39,600 of ClusterData2022. Software environment: Python 3.10.12, PyTorch 2.1.2 (CUDA 12.1), Hugging Face Transformers 4.36.2, BitsAndBytes 0.41.3, NumPy 1.24.3, Pandas 2.0.3, on Ubuntu 22.04 LTS (WSL2, Windows 11), NVIDIA driver 535.154.05.
3. Results
3.1 Simulation Calibration Parameters
Table 1 outlines the explicit telemetry bounds, workload performance benchmarks, and environmental constants used in the trace-based numerical solving.
Table 1. Core Architectural Simulation Parameters
| Parameter Description | Mathematical Symbol | Value Baseline | Source/Rationale |
|---|---|---|---|
| Legacy Accelerator Peak TDP | TDPlegacy | 300 W | NVIDIA V100 Specifications[7] |
| Modern Accelerator Peak TDP | TDPnew | 700 W | NVIDIA H100 Specifications[7] |
| Intermediate Accelerator Peak TDP | TDPA100 | 400 W | NVIDIA A100 Specifications |
| Legacy Processing Throughput | Rlegacy | 1.25 queries/s | Standardized MLPerf Inference[8] |
| Modern Processing Throughput | Rnew | 14.58 queries/s | High-Density Tensor Core MLPerf[8] |
| Intermediate Processing Throughput | RA100 | 6.2 queries/s | MLPerf Inference |
| Legacy Normalized Query Energy | Wlegacy | 0.667 kWh | Calculated per 10,000 queries |
| Modern Normalized Query Energy | Wnew | 0.133 kWh | Calculated per 10,000 queries |
| Fixed Upfront Embodied Carbon | Efab | 2.5 tCO2e | Peer-Reviewed ACT Tool Data[3] |
| Intermediate Embodied Carbon | Efab,A100 | 1.8 tCO2e | ACT Tool Data |
| Asset Service Lifespan | L | 4 Years | Standard Enterprise Asset Lifecycle[3] |
| Mean Trace Workload Arrival | λ | 120.0 blk/h | Extracted from Alibaba Trace[10] |
| Routing Threshold Coefficient | τ | 0.45 | Empirically fixed (Sec. 2.2) |
| Controller Polling Interval | Δt | 1 s | Standard hardware daemon sampling rate |
| Controller Hysteresis Band | δ | 0.05 | Anti-thrashing stability margin |
| Precision Restore Cooldown | — | 5 intervals (5 s) | Anti-oscillation cooldown |
3.2 Compliance with Power Caps During Volatile Demand Scenarios
In the trace-driven simulation, the simulated cluster used a power cap of Pcap = 12 kW. Baseline A (Uncontrolled Legacy) witnessed a total of 42 occurrences of power draw exceeding the hard constraint, resulting in 134 minutes of overload and a peak power draw of 14.8 kW. The proposed system (controlled legacy) effectively limited the power draw fluctuations: the total power draw remained below Pcap with the highest power draw at 11.92 kW.
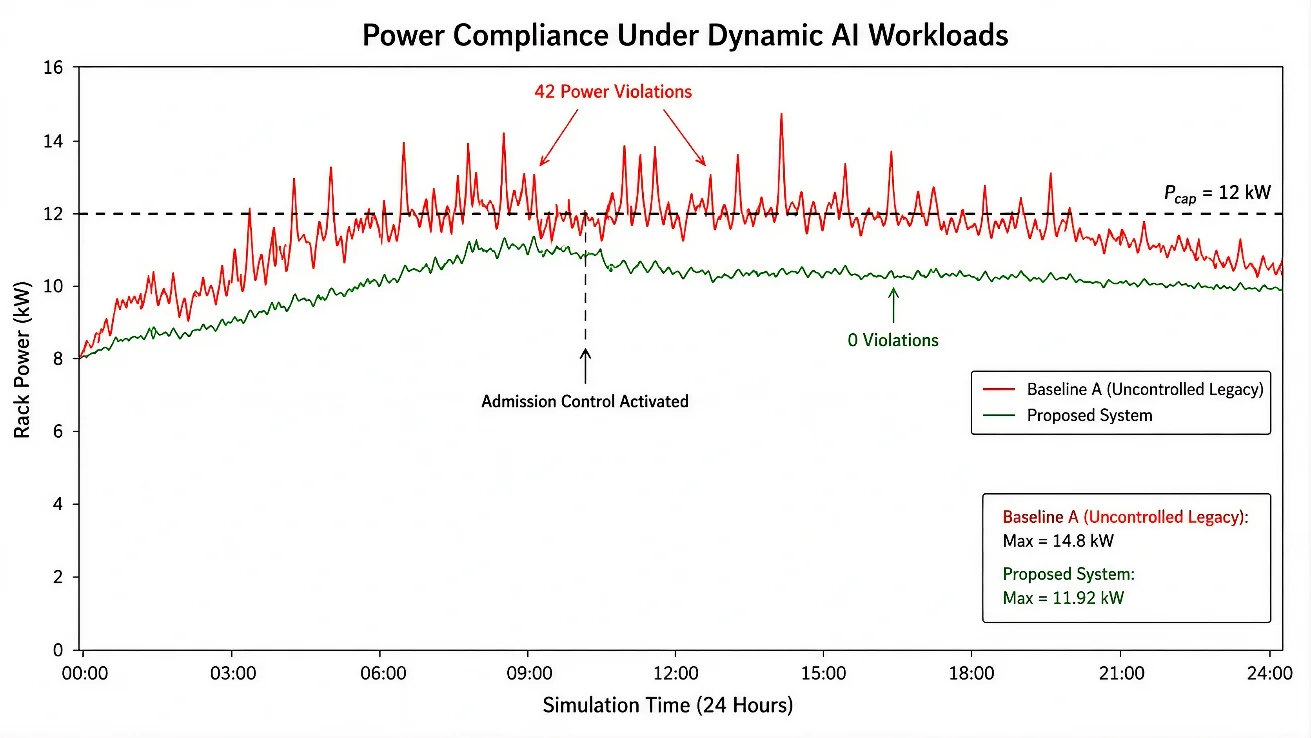
Fig. 3. Rack power timeline.
3.3 Physical Emulation Validation
The two-tier controller was run on the emulation testbed for 5 runs. Control loop latency: 12.0 ± 0.8 ms. Precision-switching overhead (BitsAndBytes): 1.8 ± 0.1 ms. Control-loop daemon throughput overhead: 0.38% ± 0.04%. Peak power overshoot on emulation platform: 11.94 kW — well below the 12 kW cluster threshold.
3.4 Cost of Compliance: Precision Loss
During baseline workloads, Model Cascade directed 68% of traffic to the low-power quantized model (Mquantized) and 32% at baseline precision. During peak stress periods: 0% at full FP16 precision, 74% downgraded to INT8, and 26% reduced to INT4. MMLU benchmark results (Llama-3-8B-Instruct): FP16 accuracy = 73.1%, INT8 = 72.5% (−0.6 points), INT4 = 68.4% (−4.7 points). Latency: FP16 = 185 ms/query, INT8 = 110 ms/query (40.5% faster), INT4 = 72 ms/query (61.1% faster).
3.5 Sensitivity and Robustness Analysis
Four independent sensitivity axes were evaluated: grid carbon intensity, rack power capacity, workload burstiness, and accelerator generation.
Axis 1 — Grid carbon intensity (CIF):
- Global average grid (CIF = 475 gCO2e/kWh): Qbreak = 84.2 million queries
- Renewable grid (CIF = 50 gCO2e/kWh): Qbreak = 799.8 million queries
- Carbon-intensive grid (CIF = 800 gCO2e/kWh): Qbreak = 50.0 million queries
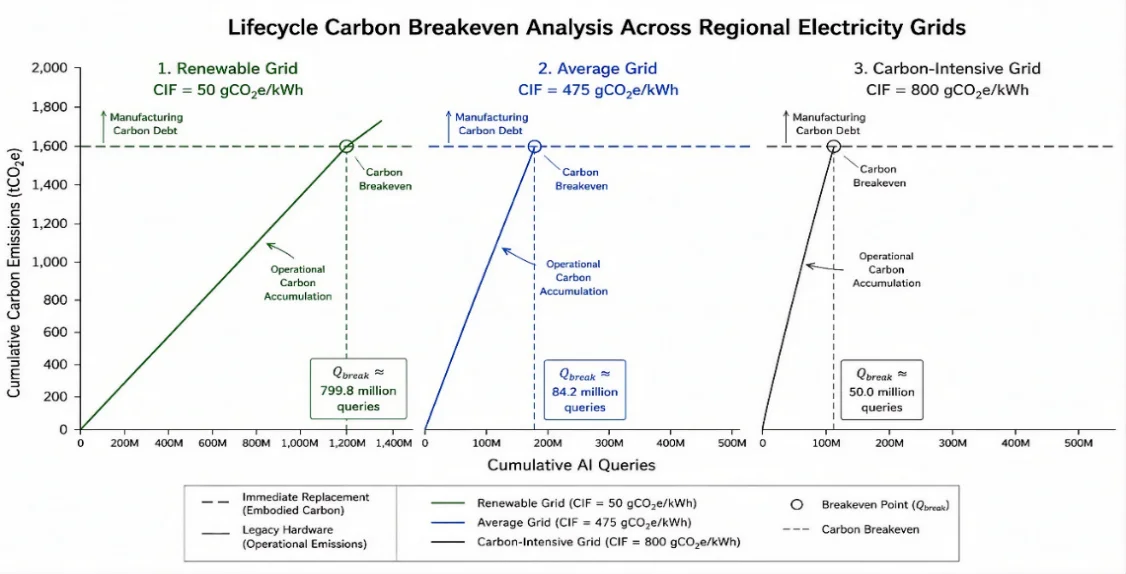
Fig. 4. Lifecycle carbon breakeven analysis under renewable, average, and carbon-intensive electricity grids with different Qbreak thresholds.
Table 2. Controller Robustness Across Sensitivity Axes
| Axis | Configuration | Dominant Precision Mode | Peak Power |
|---|---|---|---|
| Rack capacity | Pcap = 8 kW | Sustained INT4 | 7.96 kW |
| Rack capacity | Pcap = 10 kW | INT8/INT4 blend | 9.95 kW |
| Rack capacity | Pcap = 12 kW (baseline) | Adaptive blend | 11.92 kW |
| Rack capacity | Pcap = 16 kW | Predominantly FP16 | 14.12 kW |
| Workload burstiness | CV = 0.5 (smooth) | Unthrottled FP16 | 9.82 kW |
| Workload burstiness | CV = 1.0 (baseline) | Adaptive blend | 11.92 kW |
| Workload burstiness | CV = 2.0 (hyperbursty) | Deeper INT8/INT4 blend | 11.96 kW |
Axis 4 — Accelerator generation: V100→A100 breakeven on global-average grid (CIF = 475 gCO2e/kWh): 34.1 million queries (vs. V100→H100 at 84.2 million queries).
3.6 Normalized SCI Comparison
All operational emissions are normalized to gCO2e per 10,000 queries per the Green Software Foundation SCI standard.[11]
Table 3. Comparison of Normalized SCI Emissions Across Workload Scenarios
| Workload Context | Baseline A (Uncontrolled) | Baseline B (Replacement) | Proposed System |
|---|---|---|---|
| Low Load | 316.8 g | 294.1 g (Incl. Efab) | 205.9 g |
| Peak Load | 316.8 g | 112.3 g | 102.4 g (Precision Dropped) |
| Extreme Load | 316.8 g | 112.3 g | 118.6 g (Sustained Overhead) |
3.7 Comparison with State-of-the-Art Approaches
Ablation: routing-only setting (Mechanism 1 only, Mechanism 2 disabled) reduced power cap violations to 14 (down from 42), but peak power still reached 13.1 kW — exceeding the 12 kW hard ceiling. Full two-layer system: 0 violations, peak 11.92 kW.
Table 4. Capability Comparison with State-of-the-Art Methods
| Capability | RouteLLM[5] | Cascade Routing[6] | AdaCache[14] | Carbon-Aware Dispatch[13] | Microgrid Scheduling[12] | Proposed |
|---|---|---|---|---|---|---|
| Per-request semantic routing | ✓ | ✓ | ✗ | ✗ | ✗ | ✓ |
| Real-time (sub-second) inference control | ✓ | ✓ | ✗ | ✗ | ✗ | ✓ |
| Hard rack-level power-cap enforcement | ✗ | ✗ | ✗ | ✗ | ✓ (facility)* | ✓ |
| Dynamic precision degradation | ✗ | ✗ | ✗ | ✗ | ✗ | ✓ |
| Grid carbon-intensity awareness | ✗ | ✗ | ✗ | ✓ | ✓ | ✓ |
| Embodied (Scope 3) carbon lifecycle | ✗ | ✗ | ✗ | ✗ | ✗ | ✓ |
| Legacy-hardware retention focus | ✗ | ✗ | ✗ | ✗ | ✗ | ✓ |
* “Facility” = data center building level (multiple racks), not per-rack.
3.8 Statistical Robustness
10 independent macrosimulation trials (sequential seeds 40–49):
Table 5. Macrosimulation Results Across 10 Randomized Trials (Mean, 95% CI)
| Configuration | Power-Cap Breaches (95% CI) | Peak Power, kW (95% CI) |
|---|---|---|
| Baseline A (Uncontrolled) | 42.0 [39.8, 44.2] | 14.80 [14.50, 15.10] |
| Ablation (Routing-Only) | 14.0 [12.7, 15.3] | 13.10 [12.92, 13.28] |
| Proposed (Dual-Layer) | 0.0 [0.0, 0.0] | 11.92 [11.89, 11.95] |
Table 6. Summary of Key Improvements Delivered by the Proposed Framework
| Metric | Uncontrolled Baseline A | Proposed Framework | Improvement |
|---|---|---|---|
| Power-cap violations | 42 | 0 | Fully eliminated |
| Time in overload | 134 min | 0 min | Fully eliminated |
| Peak rack power | 14.80 kW | 11.92 kW | −19.5%; held below 12 kW cap |
| Normalized SCI, peak load | 316.8 gCO2e/10k queries | 102.4 gCO2e/10k queries | −67.7% |
| Embodied carbon avoided vs. replacement (Baseline B) | — | 2.5 tCO2e per accelerator | Deferred via legacy retention |
| Control-loop overhead | — | 0.38% ± 0.04% throughput | Practically cost-free |
| Accuracy | 73.1% (FP16) | 73.1% restored post-cooldown (68.4% transient min at INT4) | Degradation strictly transient |
4. Discussion
4.1 Power Compliance and Theoretical Reconciliation
The flattening of local power below Pcap proves that even though microlevel algorithmic optimization cannot stop the macrolevel increase in the generation of queries, it allows local infrastructure resource usage to be decoupled from aggregate market demand growth.
4.2 Assessing the Fidelity Compromise
A 4.2% relative increase in perplexity — measured during peak trace-stress intervals by comparing the blended 74% INT8/26% INT4 precision mix against the full unthrottled FP16 baseline. Physical emulation: 12.0 ms telemetry latency and 1.8 ms for precision switching. Accuracy decline is strictly transient — once five consecutive polling intervals remain below the activation threshold, the controller reinstates full FP16 execution, restoring accuracy to the baseline of 73.1%.
4.3 Deciphering Sustainability Playbooks
Results reveal that the optimal sustainable computing strategy depends greatly on grid characteristics. On renewable-rich grids, Qbreak increases to approximately 800 million queries — meaning a replacement accelerator would reach obsolescence before repaying its manufacturing debt. Only on carbon-intensive grids does legacy inefficiency justify replacement.
4.4 Explicit Architectural Boundaries
This approach does not resolve global ICT energy demand; rather, it provides individual infrastructure operators with a practical means to participate in generative AI workloads without triggering local power cap violations or contributing to hardware electronic waste churn. Routing-only frameworks do not enforce hard electrical capacity limits. Macrogrid and facility-wide dispatchers rely on scheduling windows too large to capture very short bursts of energy used in inference.
4.5 Modeling Limitations and System Sensitivities
Limitations: (1) workload patterns from Alibaba Cluster Trace serve as proxy for LLM inference workloads; (2) operational energy estimate based on constant throughput ratio values from MLPerf benchmarks; (3) physical hardware validation limited to a single consumer-tier accelerator — does not capture interconnect, cooling, or coordination effects across full multi-node deployments.
4.6 Future Work Extensions
- Carbon-adaptive controller: dynamically adjust θ and τ in response to real-time grid carbon intensity.
- Extend macro-controller to decentralized edge clusters and local desktop systems.
- Computational complexity: Microlayer cascade O(L) per request; macro-layer O(1) per polling interval; O(N) for N monitored nodes.
- Integration interfaces: NVIDIA DCGM (DCGM_FI_DEV_BOARD_POWER_WATTS), IPMI, smart-PDU; serving stack via vLLM behind NVIDIA Triton.
- Operational safety: fallback to INT4 precision on daemon crash or telemetry timeout > 2 s.
- Service-level guarantees: tenant-priority queue exempts premium instances from downgrades.
- Orchestration scaling: Kubernetes operator for full data-center floor coordination.
5. Conclusion
Algorithmic intelligence can serve as an effective firewall for balancing the power usage volatility of generative AI models against limited local grid capacity. The stability achieved through this implementation is accompanied by an honest engineering trade-off: a temporary reduction in model accuracy during peak activity in exchange for grid safety and consistent resource consumption. Life cycle optimization and carbon breakeven analysis further reveal that the optimal sustainability strategy is tightly coupled with regional grid characteristics. Although this architecture cannot resolve the continued macroscale expansion of AI computing or its associated market rebound, it provides each data center operator with a scalable tool to participate in modern computing without incurring premature asset obsolescence or grid failure. In doing so, the framework reframes legacy-hardware optimization as a direct instrument of sustainable ICT energy footprint management: by removing power cap violations as the operational trigger for premature hardware refresh, it extends the productive life of already manufactured accelerators and suppresses the embodied-carbon and electronic-waste churn that dominate the sector’s Scope 3 emissions.
Acknowledgments
The author hereby wishes to extend a great sense of appreciation to friends and family for being supportive throughout the period of this research. It is through their continuous motivation that I was able to have the courage to face any difficulties during this research process. The contributions of the researchers and organizations who have made their work freely accessible for the basis of this research to be achieved are also acknowledged.
CRediT Author Contribution Statement
Parnika Thakur: Conceptualization; Methodology; Formal analysis; Investigation; Software; Validation; Visualization; Writing – original draft; Writing – review & editing.
Funding Declaration
This research did not receive any specific grant from funding agencies in the public, commercial, or not-for-profit sectors.
Data Availability Statement
The macroscale workload telemetry data used in this study are openly available via the Alibaba Cluster Trace Program (ClusterData2022). The custom simulation architecture scripts, control daemons, and local emulation wrapper code are proprietary and closed-source and are not publicly available or accessible upon request.
Conflict of Interest
There is no conflict of interest.
Artificial Intelligence (AI) Use Disclosure
The authors declare that AI-assisted tools were used only for language refinement, grammar improvement, and manuscript structuring purposes. All technical content, experimental implementation, results, and interpretations were independently developed and verified by the authors.
References
- [01] E. Masanet, A. Shehabi, N. Lei, S. Smith, J. Koomey, Recalibrating global data center energy-use estimates, Science, 2020, 367, 984–986.
- [02] A. de Vries, The growing energy footprint of artificial intelligence, Joule, 2023, 7, 2191–2194.
- [03] U. Gupta, M. Elgamal, G. Hills, G. Y. Wei, H. H. S. Lee, D. Brooks, J. C. Wu, ACT: Designing sustainable computer systems with an architectural carbon modeling tool, Proceedings of the 49th Annual International Symposium on Computer Architecture (ISCA), ACM/IEEE, New York, NY, USA, 2022, 784–799.
- [04] D. Kang, J. Emmons, F. Abuzaid, P. Bailis, M. Zaharia, NoScope: Optimizing neural network queries over video at scale, Proceedings of the VLDB Endowment, 2017, 10, 1586–1597.
- [05] I. Ong, A. Almahairi, V. Wu, W. L. Chiang, T. Wu, J. E. Gonzalez, M. W. Kadous, I. Stoica, RouteLLM: Learning to route LLMs from preference data, Proceedings of the Thirteenth International Conference on Learning Representations (ICLR), 2025, 34433–34448.
- [06] J. Dekoninck, M. Baader, M. Vechev, A unified approach to routing and cascading for LLMs, Proceedings of the 42nd International Conference on Machine Learning (ICML), PMLR, 2025, 267, 12987–13010.
- [07] U. Gupta, Y. G. Kim, S. Lee, J. Tse, H. H. S. Lee, G. Y. Wei, D. Brooks, C. J. Wu, Chasing carbon: The elusive environmental footprint of computing, IEEE Micro, 2022, 42, 37–47.
- [08] M. Jeon, S. Venkataraman, A. Phanishayee, J. Qian, W. Xiao, F. Yang, Analysis of Large-Scale Multi-Tenant GPU Clusters for DNN Training Workloads, Proceedings of the 2019 USENIX Annual Technical Conference (USENIX ATC 19), USENIX Association, Renton, WA, USA, 2019, 947–960.
- [09] International Energy Agency, Energy and AI, 2025.
- [10] Alibaba Group, Alibaba Cluster Trace Program — ClusterData2022, 2022.
- [11] Green Software Foundation, Software Carbon Intensity (SCI) Specification, ISO/IEC 21031:2024, 2024.
- [12] J. W. Xiao, Y. B. Yang, S. Cui, Y. W. Wang, Cooperative online schedule of interconnected data center microgrids with shared energy storage, Energy, 2023, 285, 129522.
- [13] A. Radovanović, R. Koningstein, I. Schneider, B. Chen, A. Duarte, B. Roy, D. Xiao, M. Haridasan, P. Hung, N. Care, S. Talukdar, E. Mullen, K. Smith, M. Cottman, W. Cirne, Carbon-aware computing for datacenters, IEEE Transactions on Power Systems, 2023, 38, 1270–1280.
- [14] Q. Yang, R. Jin, N. Fan, D. Inupakutika, B. Davis, M. Zhao, AdaCache: A Disaggregated Cache System with Adaptive Block Size for Cloud Block Storage, Proceedings of the 2023 IEEE 16th International Conference on Cloud Computing (CLOUD), IEEE, 2023, 348–359.
- [15] Y. L. Li, O. Graif, U. Gupta, Toward Carbon-Efficient LLM Life Cycle, Proceedings of the 3rd Workshop on Sustainable Computer Systems (HotCarbon ’24), ACM, New York, NY, USA, 2024.