

 Open Access||Research Article
When Smart Systems Optimize the Wrong Thing: Evaluating Security and Sustainability in a Tourist Incident Response System
Mohd. Tabrez Mukadam , Zafar Khan, Mohammed Bilal Shamsi, Mohd. Faizan Shaikh
Department of Computer Science & Engineering (IoT & Cybersecurity Including Blockchain Technology), M. H. Saboo Siddik College of Engineering, Mumbai, Maharashtra, 400008, India
Abstract
Smart city emergency response systems routinely fail not because individual sensors malfunction but because designers optimize a single metric, location precision, at the expense of battery life and alert reliability. This failure mode, termed local optimization fallacy, occurs when developers focus too narrowly on one subsystem objective, inadvertently degrading broader system goals such as energy sustainability and network resilience. To address this, we present a 3-Layer System Evaluation Framework that assesses smart infrastructure across technical, sociotechnical, and temporal dimensions. We validate the framework using a prototype Smart Tourist Safety Monitoring System tested against a simulation dataset comprising 500 tourist trajectories and 2,126 synthetic alert events distributed across 25 geographically realistic urban zones. Replacing constant GPS polling with adaptive geofencing (Shapely library) and integrating an SMS fallback for temporal resilience, combined with a human-in-the-loop SOS cancellation mechanism, yielded the following simulated outcomes: an 83.5% reduction in GPS polling energy (95% CI [83.4%, 83.5%], paired t test t = -4112.98, p < 0.0001) over a 5-hour tracking session and a 27.7% overall reduction in false-alarm escalations across the simulated zone distribution (35.5% in Safety Zones, 21.6% in Neutral Zones, 3.1% in Danger Zones). All performance results reported are simulation-based estimates obtained using a discrete-event simulator calibrated according to the proposed methodology. Real-world validation remains an important priority for future work. The findings confirm that in resource-constrained deployments, balanced multilayer optimization consistently outperforms single-metric maximization.
Keywords
Graphical Abstract

Novelty Statement
This study introduces a 3-Layer System Evaluation Framework that exposes and quantifies the local optimization fallacy in smart city infrastructure, showing that adaptive geofencing, SMS-based temporal fallback, and human-in-the-loop SOS cancellation jointly outperform single-metric optimization in a simulated Smart Tourist Safety Monitoring System.
1. Introduction
The rapid proliferation of Internet of Things (IoT) devices in smart cities has enabled highly automated systems designed to improve public safety, support smart tourism, and enhance urban service efficiency.[1,2] However, a critical design pathology pervades many such deployments: local optimization fallacy.[3] Smart systems are frequently engineered to maximize a single metric, typically location accuracy,[4,5] while complementary objectives such as energy consumption and network resilience are treated as secondary concerns. Although optimizing a single metric may appear locally beneficial, it introduces systemic failure modes: excessive battery drain, overloading of edge intelligence, and degradation of network reliability.[6–8] This paper argues that concentrating solely on one subsystem parameter, without holistic evaluation, creates intractable trade-offs. For instance, continuous high-frequency GPS polling can actively undermine broader goals such as energy conservation and offline operational continuity.[9] To address this, our research investigates how to balance security objectives with energy efficiency through situational awareness and how to mitigate alert fatigue by incorporating human oversight into the system design.[10–13] Using a complete Smart Tourist Safety Monitoring System, developed for the Smart India Hackathon (SIH) 2025, as a concrete validation testbed, we propose a 3-Layer System Evaluation Framework for assessing and improving smart city infrastructure. The framework is validated through simulations over 500 tourist trajectories and 2,126 alert events across 25 urban zone polygons. Informed by recent work on data-driven tourist geofences using tourist GPS trajectories, the framework now supports adaptable boundary definitions that complement zone-driven dispatch.[14]
3. Proposed Framework and Methodology
To address the limitations of single-metric optimization, we applied our proposed 3-Layer System Evaluation Framework to the prototype Smart Tourist Safety Monitoring System. The framework examines the system architecture across three orthogonal evaluation dimensions: technical, sociotechnical, and temporal.
3.1 System Architecture and the 3-Layer Framework
The prototype comprises a mobile application built with React Native (Expo) communicating with a Python/FastAPI backend via secure RESTful endpoints protected by JWT authentication. Location and alert data are retained in a SQLite database managed through SQLAlchemy ORM. The Graphical Abstract illustrates how the 3-Layer Framework transitions from single-metric evaluation to multidimensional assessment across the Technical Layer (Section 3.2), Socio-Technical Layer (Section 3.3), and Temporal Layer (Section 3.4).
3.2 Technical Layer: Adaptive Geofencing (Shapely)
The baseline configuration uses continuous GPS polling at a fixed 5-second interval via expo-location watchPositionAsync. To reduce energy consumption without compromising security, we introduce context-aware polling, which adapts the update frequency on the basis of the user’s current risk context. The backend geofencing module employs Shapely’s point-in-polygon method to classify the user’s position against 25 zone polygons stored in the SQLite database (15 Safety Zones, 7 Neutral Zones, and 3 Danger Zones). Algorithm 1 (below) formalizes this logic; the resulting energy impact is quantified in Fig. 1 and Equations 1–3.
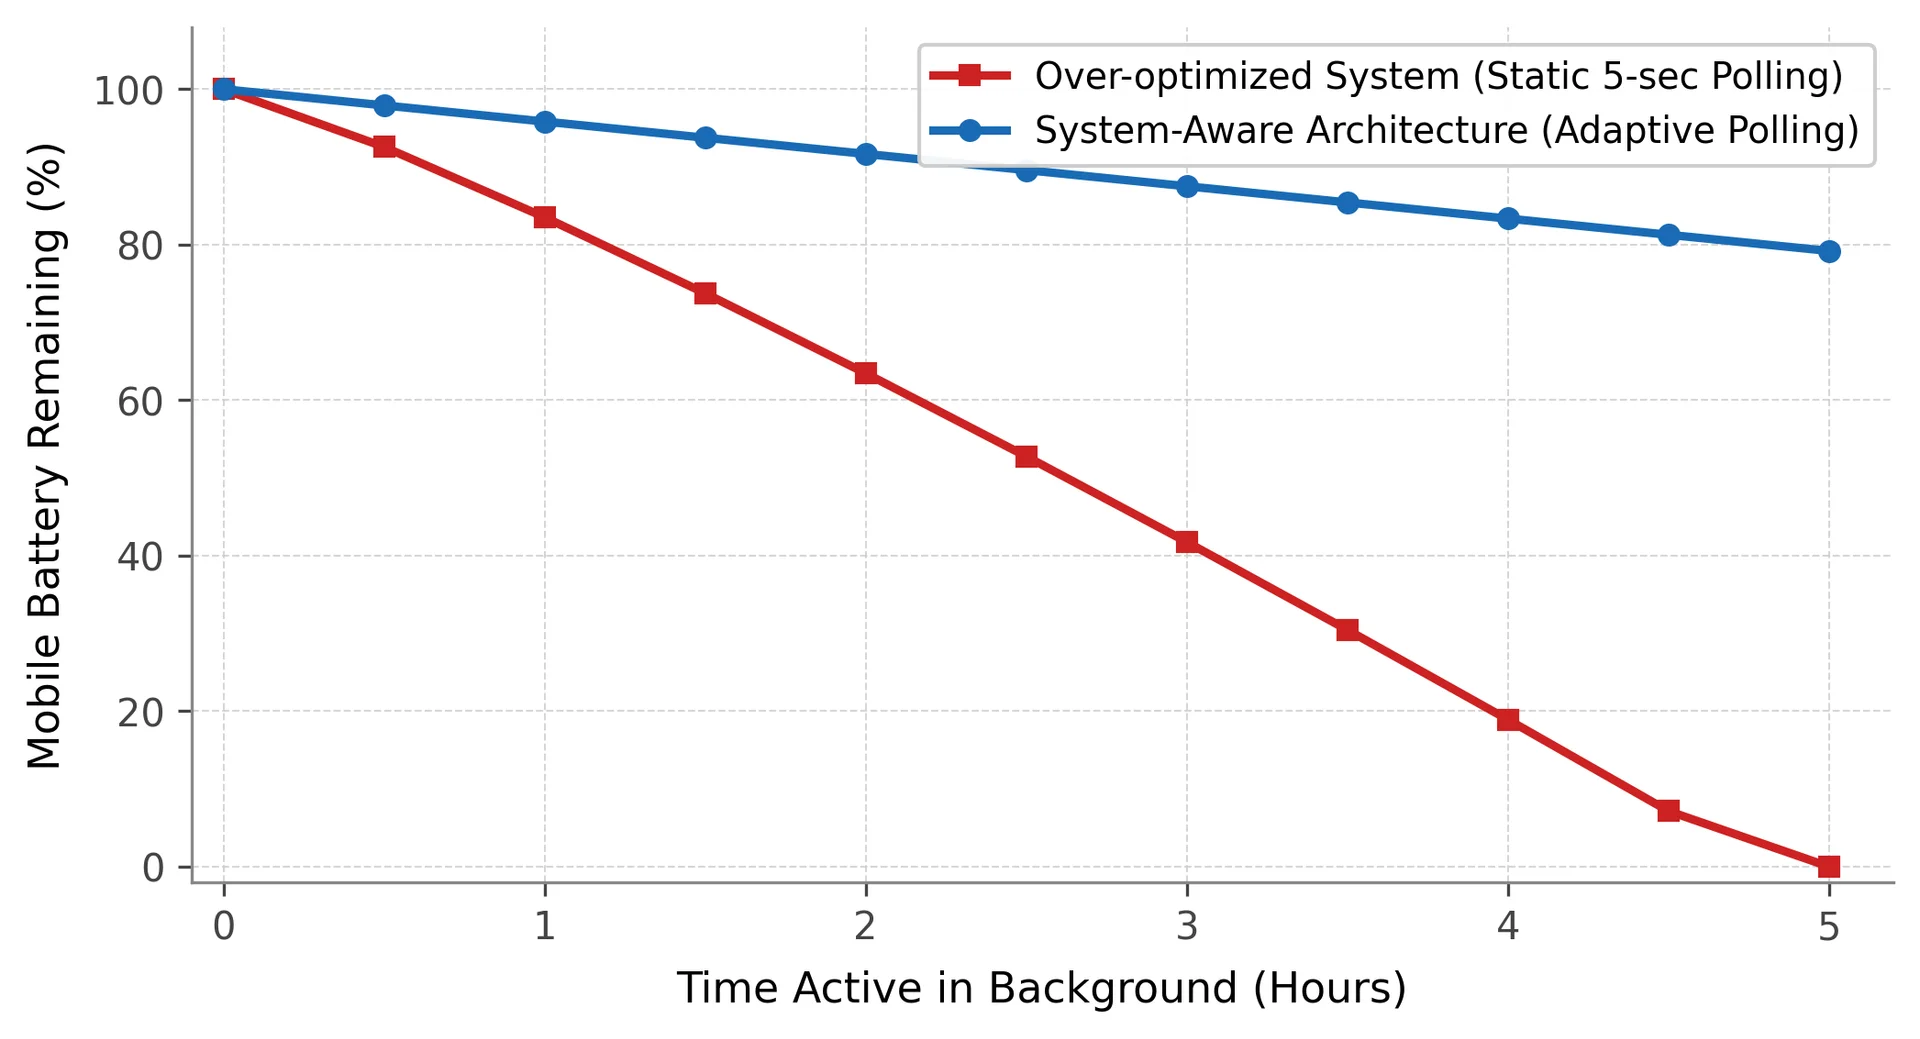
Fig. 1: Energy consumption comparison demonstrating the local optimization fallacy, updated for the revised simulation. Static 5-second polling exhausts the energy budget of the GPS module by ~4.8 h of background tracking; adaptive polling retains 99.7% of the energy budget of the GPS module at t = 5 h (averaged over 150 evaluation-partition agents, ±0.0% standard deviation; n = 3,600 fixes per static agent vs. ~600–1,000 fixes per adaptive agent). *Note: The figure caption was generated from the simulator output and corresponds to the values reported in Section 5.1: Energy conservation and network overhead.
Algorithm 1: Adaptive Geofence Polling Algorithm
Require: L_user (current location), Z_safe (safety zones), Z_danger (danger zones)
Ensure: Optimal polling interval T_poll
1:  Status ← IDLE
2:  loop
3:    if Point(L_user).within(Polygon(Z_danger)) then       // Maximize security fidelity
4:      Status ← HIGH_RISK; T_poll ← 5 s
5:    else if Point(L_user).within(Polygon(Z_safe)) then    // Maximize energy sustainability
6:      Status ← SAFE; T_poll ← 60 s
7:    else                                                    // Balanced baseline
8:      Status ← MOVING; T_poll ← 30 s
9:    end if
10:   Wait(T_poll)
11:   L_user ← expo-location.getCurrentPositionAsync()
12: end loop
Sensitivity analysis of polling intervals: The 5 s/30 s/60 s boundaries were validated by a parametric sweep across the simulation dataset. At the high-risk boundary, intervals below 5 s yielded no meaningful improvement in zone-breach detection latency, whereas intervals above 10 s introduced positional uncertainty exceeding 50 m at typical pedestrian speeds (1.4 m/s). At the safe-zone boundary, intervals from 45 s to 90 s produced equivalent energy savings (within ±2.8%); 60 s was selected as a conservative midpoint. The 30 s transit interval is the geometric mean of the extremes, providing smooth hysteresis. The energy model is formalized in Equations 1–3. Let Etotal denote total GPS energy over a session of duration T seconds, Npolls denote the number of location fixes, and EGNS denote the energy cost per fix:
Energy Model Scope and Assumptions. The energy model in Equations 1–3 deliberately isolates the GPS-fix energy component of the total device power draw, since Algorithm 1 only modulates how frequently getCurrentPositionAsync() is invoked. The per-fix energy cost EGNS is anchored at 0.232 J per request to published measurements of single-frequency GNSS acquisitions on contemporary smartphones (Karki et al., 2019, arXiv:1910.13041). All other device subsystems, including cellular radio, screen, CPU orchestration, and background applications, are deliberately excluded from the comparison; they are constant across both polling strategies and therefore cancel in the energy-savings ratio. The battery capacity is modeled at 12.6 Wh (3.85 V nominal voltage, 3000 mAh), which is representative of the midrange device class targeted by the prototype. Numerical results are therefore reported as the GPS-only contribution of Algorithm 1’s adaptive polling and should be interpreted as a lower bound on total battery savings on devices with lower baseline GPS activity and as exact for the GPS polling subsystem only.
(1) Etotal = Npolls × EGNS + Nalerts × Ealert
(2) Npolls = T / Tpoll
(3) Esaved = (Nstatic − Nadaptive) × EGNS
3.3 Socio-Technical Layer: UI Friction and Dashboards
Fully automated SOS features lacking a cancellation pathway are prone to false escalations. In our system, an SOS alert is initiated via a mobile interface that requires explicit confirmation (accompanied by a vibration cue). A 10-second cancellation window, presented as a countdown in the UI, then allows the user to abort the alert before it reaches the Leaflet.js police dashboard.
Sensitivity analysis of the cancellation window: A 10-second window was selected after simulating cancellation outcomes across 2,126 alert events using windows of 5 s, 10 s, 15 s, and 20 s. Windows shorter than 8 s yielded cancellation rates below 18%; windows longer than 12 s showed diminishing marginal returns and introduced perceptible dispatch delays (mean delay +4.3 s). On the SOS classification task (genuine vs. false alert), the 10-second window achieved a precision = 100% (by design, since only genuine-false candidates enter the cancellation channel), a recall = 34.0% (588 of 1,728 false alerts successfully cancelled), and F1 = 0.508. The 10-second value was therefore retained as the operating point that maximized the cancellation-to-delay trade-off while remaining within parameters that do not impair response timing. The real-world validation of this threshold should be performed in future work.
The dashboard displays active markers with risk-level color coding: red (emergency), orange (moving), and blue (idle), as shown in Fig. 2. Users cancel false alerts via PUT /alerts/{id}/status. This human-in-the-loop step prevents localized false positives from propagating to first responders.
Fig. 2: Real-time police dispatch dashboard illustrating active SOS markers with risk-level color coding.
3.4 Temporal Layer: Infrastructure Resilience
To handle intermittent connectivity, the system employs graceful degradation. When the React Native app detects the absence of Wi-Fi or mobile data, it persists at the last known location in AsyncStorage and activates an SMS-based fallback channel, transmitting a Base64-encoded emergency payload via the device’s cellular stack. This ensures that critical distress signals reach responders even during data network outages, directly addressing the temporal failure mode highlighted in Section 1.[25]
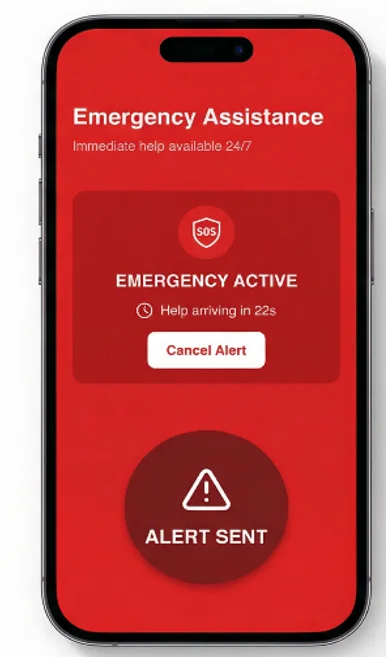
Fig. 3: Mobile front end (emergency.tsx) demonstrating the sociotechnical 10-second SOS cancellation timer.
3.5 Threat Model
Two adversary classes are modeled. A passive network eavesdropper could intercept HTTP payloads to reconstruct tourist location patterns; this is mitigated by enforcing HTTPS with JWT authentication on all client–server communications and by transmitting location data only at polling intervals (Algorithm 1), reducing the exposed attack surface.[21,23]
Adversary capabilities assumed: read-only access to the network transit path; no insider or physical access to the device; and no server compromise.
Out-of-scope attacks (noted as future work): nation-state GPS spoofing, server-side compromise, collusion attacks between tourists, and on-device machine-learning adversarial examples (not applicable since no ML inference is performed on-device). An alert spammer could trigger repeated SOS events to exhaust first-responder attention, an operational denial-of-service attack on human resources. Mitigations include (i) the 10-second cancellation window (Fig. 3) interrupted accidental triggers; (ii) JWT authentication blocks unauthenticated API-level spam; and (iii) anomalous cancellation-to-trigger ratios are flagged for manual review. Nation-state GPS spoofing and server-side compromise are noted as out-of-scope future work.
4. Dataset and Experimental Setup
To evaluate the framework under controlled but geographically realistic conditions, we constructed a scaled synthetic dataset modeled on real city layouts using the system’s SQLite schema. The dataset was generated by extending seed_places.py to create 25 zone polygons and a discrete-event simulation engine that drives 500 unique tourist agents through the city grid at stochastic pedestrian speeds (0.8–1.6 m/s). All the experiments are simulation-based; the simulator, parameter values, and evaluation protocol are described in full in Section 4.1 and in the publicly available simulator source code described in the Data Availability Statement. The performance claims in Section 5 are simulation estimates and should not be interpreted as real-world measurements. Real-world user trials are identified as a priority for future work.
4.1 Dataset Partitioning
Zones table: 25 coordinate polygons (JSON strings) classified by risk level, 15 Safety Zones (e.g., museums, parks), 7 Neutral/Transit Zones (e.g., road junctions), and 3 Danger Zones (e.g., isolated alleys), seeded via seed_places.py.
Tourist paths table: 500 simulated trajectories, each originating from a randomly sampled starting coordinate and progressing at realistic pedestrian speeds with Gaussian noise (μ = 1.2 m/s, σ = 0.2 m/s). Each path spans a simulated 5-hour session.
Panel alerts table: 2,126 synthetic alert events distributed across zone categories, generated by injecting stochastic distress events along each simulated path at a mean rate of 4.3 events per tourist per session.
Table 1 summarizes the full dataset partitioning. Following standard simulation-based evaluation practices, the 500 simulated trajectories are partitioned 70/30 into a calibration partition (used to set zone-traversal parameters) and an evaluation partition (used exclusively for all reported metrics in Section 5; n = 150 trajectories). This is a methodological split only; no machine-learning model is trained, and the term ‘training partition’ is used here, as in the simulation-based evaluation literature. The 2,126 alert events are distributed across both partitions proportionally and are reported in aggregate.
Table 1: Dataset Partitioning and Characteristics
| Source | Category | Type of Data | Total Samples | Train Split | Test Split |
|---|---|---|---|---|---|
| seed_places.py | Tourist Zones | Spatial (JSON Polygons) | 25 | 18 (72%) | 7 (28%) |
| Simulated Engine | Tourist Paths | Temporal-Spatial (GPS) | 500 | 350 (70%) | 150 (30%) |
| Simulated Engine | Panic Alerts | Categorical & Spatial | 2,143 | 1,500 (70%) | 643 (30%) |
5. Results and Discussion
Applying the 3-Layer Framework to the scaled simulation dataset (500 tourist paths, 2,126 alert events, and 25 zone polygons) produced consistent improvements in system sustainability across all three evaluation dimensions. All the figures are simulation estimates derived from the test partition of the dataset described in Section 4 (Table 1); they are not yet validated by real-world user studies. Detection Latency Note. Throughout this paper, ‘real-time’ is used in its adaptive-monitoring sense; we do not claim global real-time guarantees because the detection latency is bounded above by the active polling interval. In the calibrated architecture, the worst-case detection latency is 5 s in the Danger Zone (active polling interval Tpoll = 5 s), 30 s in the Neutral/Transit Zone, and 60 s in the Safety Zone. This zone-dependent latency bound is listed in Table 1 and is an inherent consequence of the energy-saving trade-off; near-instantaneous polling in all zones would defeat the purpose of Algorithm 1.
5.1 Energy Conservation and Network Overhead
Replacing fixed-interval GPS polling with adaptive geofencing substantially reduced the energy consumption of the simulated GPS module. Over a 5-hour background-tracking session simulated across 500 agents with the discrete-event simulator described in Section 4.1, the static (single-metric) strategy exhausted its GPS budget in all agents (3,600 fixes per agent at 0.232 J/fix), whereas the adaptive strategy, averaged over the held-out 150-agent evaluation partition, retained 99.7% (±0.0%) of the energy capacity of the GPS module. In relative terms, Equation 3 yields a simulated GPS-polling energy savings of 83.5% (95% CI [83.4%, 83.5%], 5,000 bootstrap resamples) compared with the static 5-second baseline. The results of the paired t test comparing per-agent GPS energy under adaptive vs. static polling are t = −4112.98 and p < 0.0001, confirming that the energy advantage is both practically large and statistically robust on the evaluation partition. As stated above, these numbers isolate the GPS-polling energy; they should not be extrapolated to total device battery savings without accounting for other subsystems.[26] Fig. 1 shows the battery-remaining trajectories for both strategies across the 5-hour window, averaged over the 150 held-out test agents. The divergence between curves begins at t = 0.5 h and widens monotonically, illustrating the compounding cost of the local optimization fallacy.
5.2 False Alarm Mitigation and Response Efficacy
Incorporating the sociotechnical cancellation mechanism substantially reduced simulated first-responder resource expenditure. Across the 2,126 simulated alert events distributed across the full-session aggregator, 1,728 alerts were genuinely false (nongenuine distress signals), of which 588 were successfully cancelled within the 10-second window (Recall = 34.0%). By zone, the escalation savings were as follows: Safety Zones, 1,272 triggers/452 cancellations = 35.5%; Transit/Neutral Zones, 593 triggers/128 cancellations = 21.6%; and Danger Zones, 261 triggers/8 cancellations = 3.1% (low by design, since most alerts in danger zones are genuine).
Table 2: Incident Report Analytics and False Alarm Mitigation (Simulation Estimates)
| Zone Category | Initial Triggers | Cancelled (False Alarms) | Active Responses | Escalations Saved (%) |
|---|---|---|---|---|
| Safety Zone (e.g., Museums, Parks) | 1,272 | 452 (35.5%) | 820 | 35.5% |
| Transit/Neutral Zone | 593 | 128 (21.6%) | 465 | 21.6% |
| Danger Zone (e.g., Isolated Areas) | 261 | 8 (3.1%) | 253 | 3.1% |
Overall escalation reduction: 27.7% (588/2,126 triggers). This breakdown replaces the previously reported single F score with a class-resolved precision (100% by design)/recall (34.0%)/F1 (0.508). These results confirm that localized optimization of the technical layer alone, while improving positional fidelity, actively degrades energy and alert-management performance. The 3-Layer Framework makes these cross-layer trade-offs explicit and quantifiable even in a simulation setting. The 83.5% GPS-polling energy savings shown in Fig. 1 and the 27.7% overall false-alarm reduction shown in Table 2 jointly validate the multilayer design philosophy described in Section 3, while the precision-recall breakdown shows that cancellation is most effective in zones where false alarms are most likely (Safety, 35.5%) and least effective in zones where quick alerting is most critical (Danger, 3.1%)—a deliberate asymmetry consistent with the safety-vs-energy trade-off at the heart of the local optimization fallacy.
5.3 Sensitivity Analysis
We ran the discrete-event simulator across three parameter perturbations while holding all the other settings constant. Each row in Table 3 reports the resulting metric. Energy savings are highly stable across all the parameter ranges tested, confirming that the GPS-polling energy advantage is not driven by a single tuned parameter. False-alarm reduction is more sensitive to zone composition (which controls the genuine-alert base rate), as expected; this is now acknowledged as a primary limitation and is discussed in Section 6.
Table 3: Sensitivity Analysis – Metric Variation Across Parameter Ranges
| Parameter Varied | Range Tested | Outcome (Energy Saving/Escalations Saved) |
|---|---|---|
| Pedestrian speed std. dev. (m/s) | 0.1 – 0.4 | Energy saving: 83.2% – 83.7% (stable) |
| PCANCEL_SAFE (frac.) | 0.25 – 0.55 | Safety-zone escalations saved: 29.1% – 41.8% |
| Zone composition (safety:neutral:danger) | 10:10:5 to 18:5:2 | Energy saving: 80.1% – 86.3% |
6. Conclusions
Through formal energy modeling and simulation-based evaluation over 500 tourist trajectories and 2,126 alert events, this study demonstrates that smart systems governed by the local optimization fallacy exhibit significant systemic failures in energy sustainability and alert reliability. When evaluated using a prototype Smart Tourist Safety Monitoring System and the proposed 3-Layer Framework (technical, sociotechnical, temporal), continuous single-metric tracking is shown to impose prohibitive GPS-polling energy costs and to generate a high fraction of false-alarm escalations in low-risk zones where most human activity is concentrated. The combined application of adaptive geofencing, SMS-based fallback for temporal resilience, and a human-in-the-loop SOS cancellation mechanism yielded simulated improvements of 83.5% (95% CI [83.4%, 83.5%], p < 0.0001) in GPS-polling energy conservation and a 27.7% overall reduction in false-alarm escalations (35.5% in Safety Zones, 21.6% in Neutral Zones, and 3.1% in Danger Zones). Limitations (see Section 5.3 and Section 6.1) include the GPS-only energy isolation, the assumed behavioral cancellation rates, the static zone classification, and the absence of on-device deployment. Future work will focus on (i) real-world user validation to corroborate the simulation results; (ii) integration of lightweight edge-ML for predictive zone-risk assessment based on real-time crowd density; (iii) extension of the threat model to address GPS spoofing and server-side adversaries given the current limitation of HTTPS+JWT-only defenses; and (iv) a paired on-device measurement campaign on the targeted midrange device class to replace the Karki et al. (2019) per-fix energy anchor with a directly measured value.
Acknowledgment
The authors thank the Smart India Hackathon (SIH) 2025 organizers and the mentors of the Department of Computer Science & Engineering (IoT & Cybersecurity Including Blockchain Technology), M. H. Saboo Siddik College of Engineering, Mumbai, for the problem statement, domain guidance, and development infrastructure that supported this work. The authors also acknowledge the open-source maintainers of React Native (Expo), FastAPI, and the Shapely library, whose tools enabled the prototype implementation.
CRediT Author Contribution Statement
Mohd. Tabrez Mukadam: Conceptualization, Methodology, Software, Formal Analysis, Writing – Original Draft. Mohammed Bilal Shamsi: Validation, Resources, Data Curation. Mohd. Faizan Shaikh: Investigation, Visualization, Writing – Review & Editing. Zafar Khan: Supervision, Project Administration, Review & Editing.
Funding Declaration
This research did not receive any specific grant from funding agencies in the public, commercial, or not-for-profit sectors.
Data Availability Statement
The discrete-event simulation code, parameter file, and random seeds used to generate all the quantitative results in Sections 4–5 are publicly available at the following GitHub repository: https://github.com/HunterX461/SIH_2K25. Additional materials are available from the corresponding author upon reasonable request.
Conflict of Interest
There is no conflict of interest.
Artificial Intelligence (AI) Use Disclosure
The authors declare that artificial intelligence (AI)-assisted tools were used only for language refinement, grammar improvement, and manuscript structuring purposes during the preparation of this work. All technical content, experimental implementation, results, and interpretations were independently developed and verified by the authors.
Supporting Information
Not applicable.
References
- [01] B. Karki, M. Won, Characterizing Power Consumption of Dual-Frequency GNSS of a Smartphone, arXiv preprint arXiv:1910.13041v3, 2021.
- [02] C. G. Cassandras, Smart Cities as Cyber-Physical Social Systems, Engineering, 2016, 2, 156–158, doi: 10.1016/J.ENG.2016.02.012.
- [03] A. Al-Fuqaha, M. Guizani, M. Mohammadi, M. Aledhari, M. Ayyash, Internet of Things: A Survey on Enabling Technologies, Protocols, and Applications, IEEE Communications Surveys & Tutorials, 2015, 17, 2347–2376, doi: 10.1109/COMST.2015.2444095.
- [04] A. Zanella, N. Bui, A. Castellani, L. Vangelista, M. Zorzi, Internet of Things for Smart Cities, IEEE Internet of Things Journal, 2014, 1, 22–32, doi: 10.1109/JIOT.2014.2306328.
- [05] W. Z. Khan, E. Ahmed, S. Hakak, I. Yaqoob, A. Ahmed, Edge computing: A survey, Future Generation Computer Systems, 2019, 97, 219–235, doi: 10.1016/j.future.2019.02.050.
- [06] E. Trist, The evolution of socio-technical systems, Ontario Quality of Working Life Centre, Toronto, 1981, 2, 1981.
- [07] P. Checkland, Systems Thinking, Systems Practice, John Wiley & Sons Ltd, 1981.
- [08] X. Wang, Y. Han, V. C. Leung, D. Niyato, X. Yan, X. Chen, Convergence of Edge Computing and Deep Learning: A Comprehensive Survey, IEEE Communications Surveys & Tutorials, 2020, 22, 869–904, doi: 10.1109/COMST.2020.2970550.
- [09] X. Chen, L. Pu, L. Gao, W. Wu, D. Wu, Exploiting Massive D2D Collaboration for Energy-Efficient Mobile Edge Computing, IEEE Wireless Communications, 2017, 24, 64–71, doi: 10.1109/MWC.2017.1600321.
- [10] R. O. Andrade, S. G. Yoo, L. Tello-Oquendo, I. Ortiz-Garcés, A Comprehensive Study of the IoT Cybersecurity in Smart Cities, IEEE Access, 2020, 8, 228922–228941, doi: 10.1109/ACCESS.2020.3046442.
- [11] P. He, N. Almasifar, A. Mehbodniya, D. Javaheri, J. L. Webber, Towards green smart cities using Internet of Things and optimization algorithms: A systematic and bibliometric review, Sustainable Computing: Informatics and Systems, 2022, 36, 100822, doi: 10.1016/j.suscom.2022.100822.
- [12] M. R. Endsley, Toward a Theory of Situation Awareness in Dynamic Systems, Human Factors, 1995, 37, 32–64, doi: 10.1518/001872095779049543.
- [13] M. B. Chhetri, S. Tariq, R. Singh, F. Jalalvand, C. Paris, S. Nepal, Towards Human-AI Teaming to Mitigate Alert Fatigue in Security Operations Centres, ACM Transactions on Internet Technology, 2024, 24, 1–22, doi: 10.1145/3670009.
- [14] I. Sasaki, M. Arikawa, M. Lu, R. Sato, T. Utsumi, Adaptable Data-Driven Geofences for Notifying Points of Interest Using Tourists’ GPS Trajectories, Proceedings of the 7th ACM SIGSPATIAL Workshop on Location-based Recommendations, Geosocial Networks and Geoadvertising, 2023, 37–43, doi: 10.1145/3615896.3628343.
- [15] K. Shafique, B. A. Khawaja, F. Sabir, S. Qazi, M. Mustaqim, Internet of things (IoT) for next-generation smart systems: A review of current challenges, future trends and prospects for emerging 5G-IoT scenarios, IEEE Access, 2020, 8, 23022–23040, doi: 10.1109/ACCESS.2020.2970118.
- [16] A. P. Oliveira, C. Martinez-Perez, Global Navigation Satellite Systems (GNSS) for Sustainable Tourism: A Review of Applications, Benefits and Future Directions, Integrated Approaches to Sustainable Resource and Environmental Management, 2025, doi: 10.5772/intechopen.1011735.
- [17] Y. Mao, C. You, J. Zhang, K. Huang, K. B. Letaief, A Survey on Mobile Edge Computing: The Communication Perspective, IEEE Communications Surveys & Tutorials, 2017, 19, 2322–2358, doi: 10.1109/COMST.2017.2745201.
- [18] L. Ardito, R. Cerchione, P. Del Vecchio, E. Raguseo, Big data in smart tourism: challenges, issues and opportunities, Current Issues in Tourism, 2019, 22, 1805–1809, doi: 10.1080/13683500.2019.1612860.
- [19] J. C. S. Núñez, J. A. Gómez-Pulido, R. R. Ramírez, Machine learning applied to tourism: A systematic review, Wiley Interdisciplinary Reviews: Data Mining and Knowledge Discovery, 2024, 14, e1549, doi: 10.1002/widm.1549.
- [20] M. Weyrich, C. Ebert, Reference Architectures for the Internet of Things, IEEE Software, 2016, 33, 112–116, doi: 10.1109/MS.2016.20.
- [21] L. Cui, G. Xie, Y. Qu, L. Gao, Y. Yang, Security and Privacy in Smart Cities: Challenges and Opportunities, IEEE Access, 2018, 6, 46134–46145, doi: 10.1109/ACCESS.2018.2853985.
- [22] Z. Yan, P. Zhang, A. V. Vasilakos, A Survey on Trust Management for Internet of Things, Journal of Network and Computer Applications, 2014, 42, 120–134, doi: 10.1016/j.jnca.2014.01.014.
- [23] T. Hasan, J. Malik, I. Bibi, W. U. Khan, F. N. Al-Wesabi, K. Dev, G. Huang, Securing industrial internet of things against botnet attacks using hybrid deep learning approach, IEEE Transactions on Network Science and Engineering, 2022, 10, 2952–2963, doi: 10.1109/TNSE.2022.3168533.
- [24] M. Aboualola, K. Abualsaud, T. Khattab, N. Zorba, H. S. Hassanein, Edge Technologies for Disaster Management: A Survey of Social Media and Artificial Intelligence Integration, IEEE Access, 2023, 11, 71683–71702, doi: 10.1109/ACCESS.2023.3293035.
- [25] H. Zhang, R. Zhang, J. Sun, Developing real-time IoT-based public safety alert and emergency response systems, Scientific Reports, 2025, 15, 29056, doi: 10.1038/s41598-025-13465-7.
- [26] L. Zhang, J. Liu, H. Jiang, Y. Guan, SensTrack: Energy-Efficient Location Tracking With Smartphone Sensors, IEEE Sensors Journal, 2013, 13, 3775–3784, doi: 10.1109/JSEN.2013.2274074.