

 Open Access||Research Article
Analysis of Surface Meteorological Parameters Associated with Wet Days in Maiduguri, Northeastern Nigeria
Emmanuel Yohanna1 , Gillian Musah Edward2, Bala Gabriel Abraham3, Umar Jidda Fatima1, Hauwa Mohammed4
1 Department of Physics, Kashim Ibrahim University, Maiduguri, Borno State, 602104, Nigeria
2 Department of Human Kinetic and Health Education, Taraba State University, Jalingo, Taraba State, 660213, Nigeria
3 Department of Physics, Federal University Gashua, Yobe State, 631001, Nigeria
4 Nursing Department, College of Nursing Maiduguri, Borno State, 600211, Nigeria
Abstract
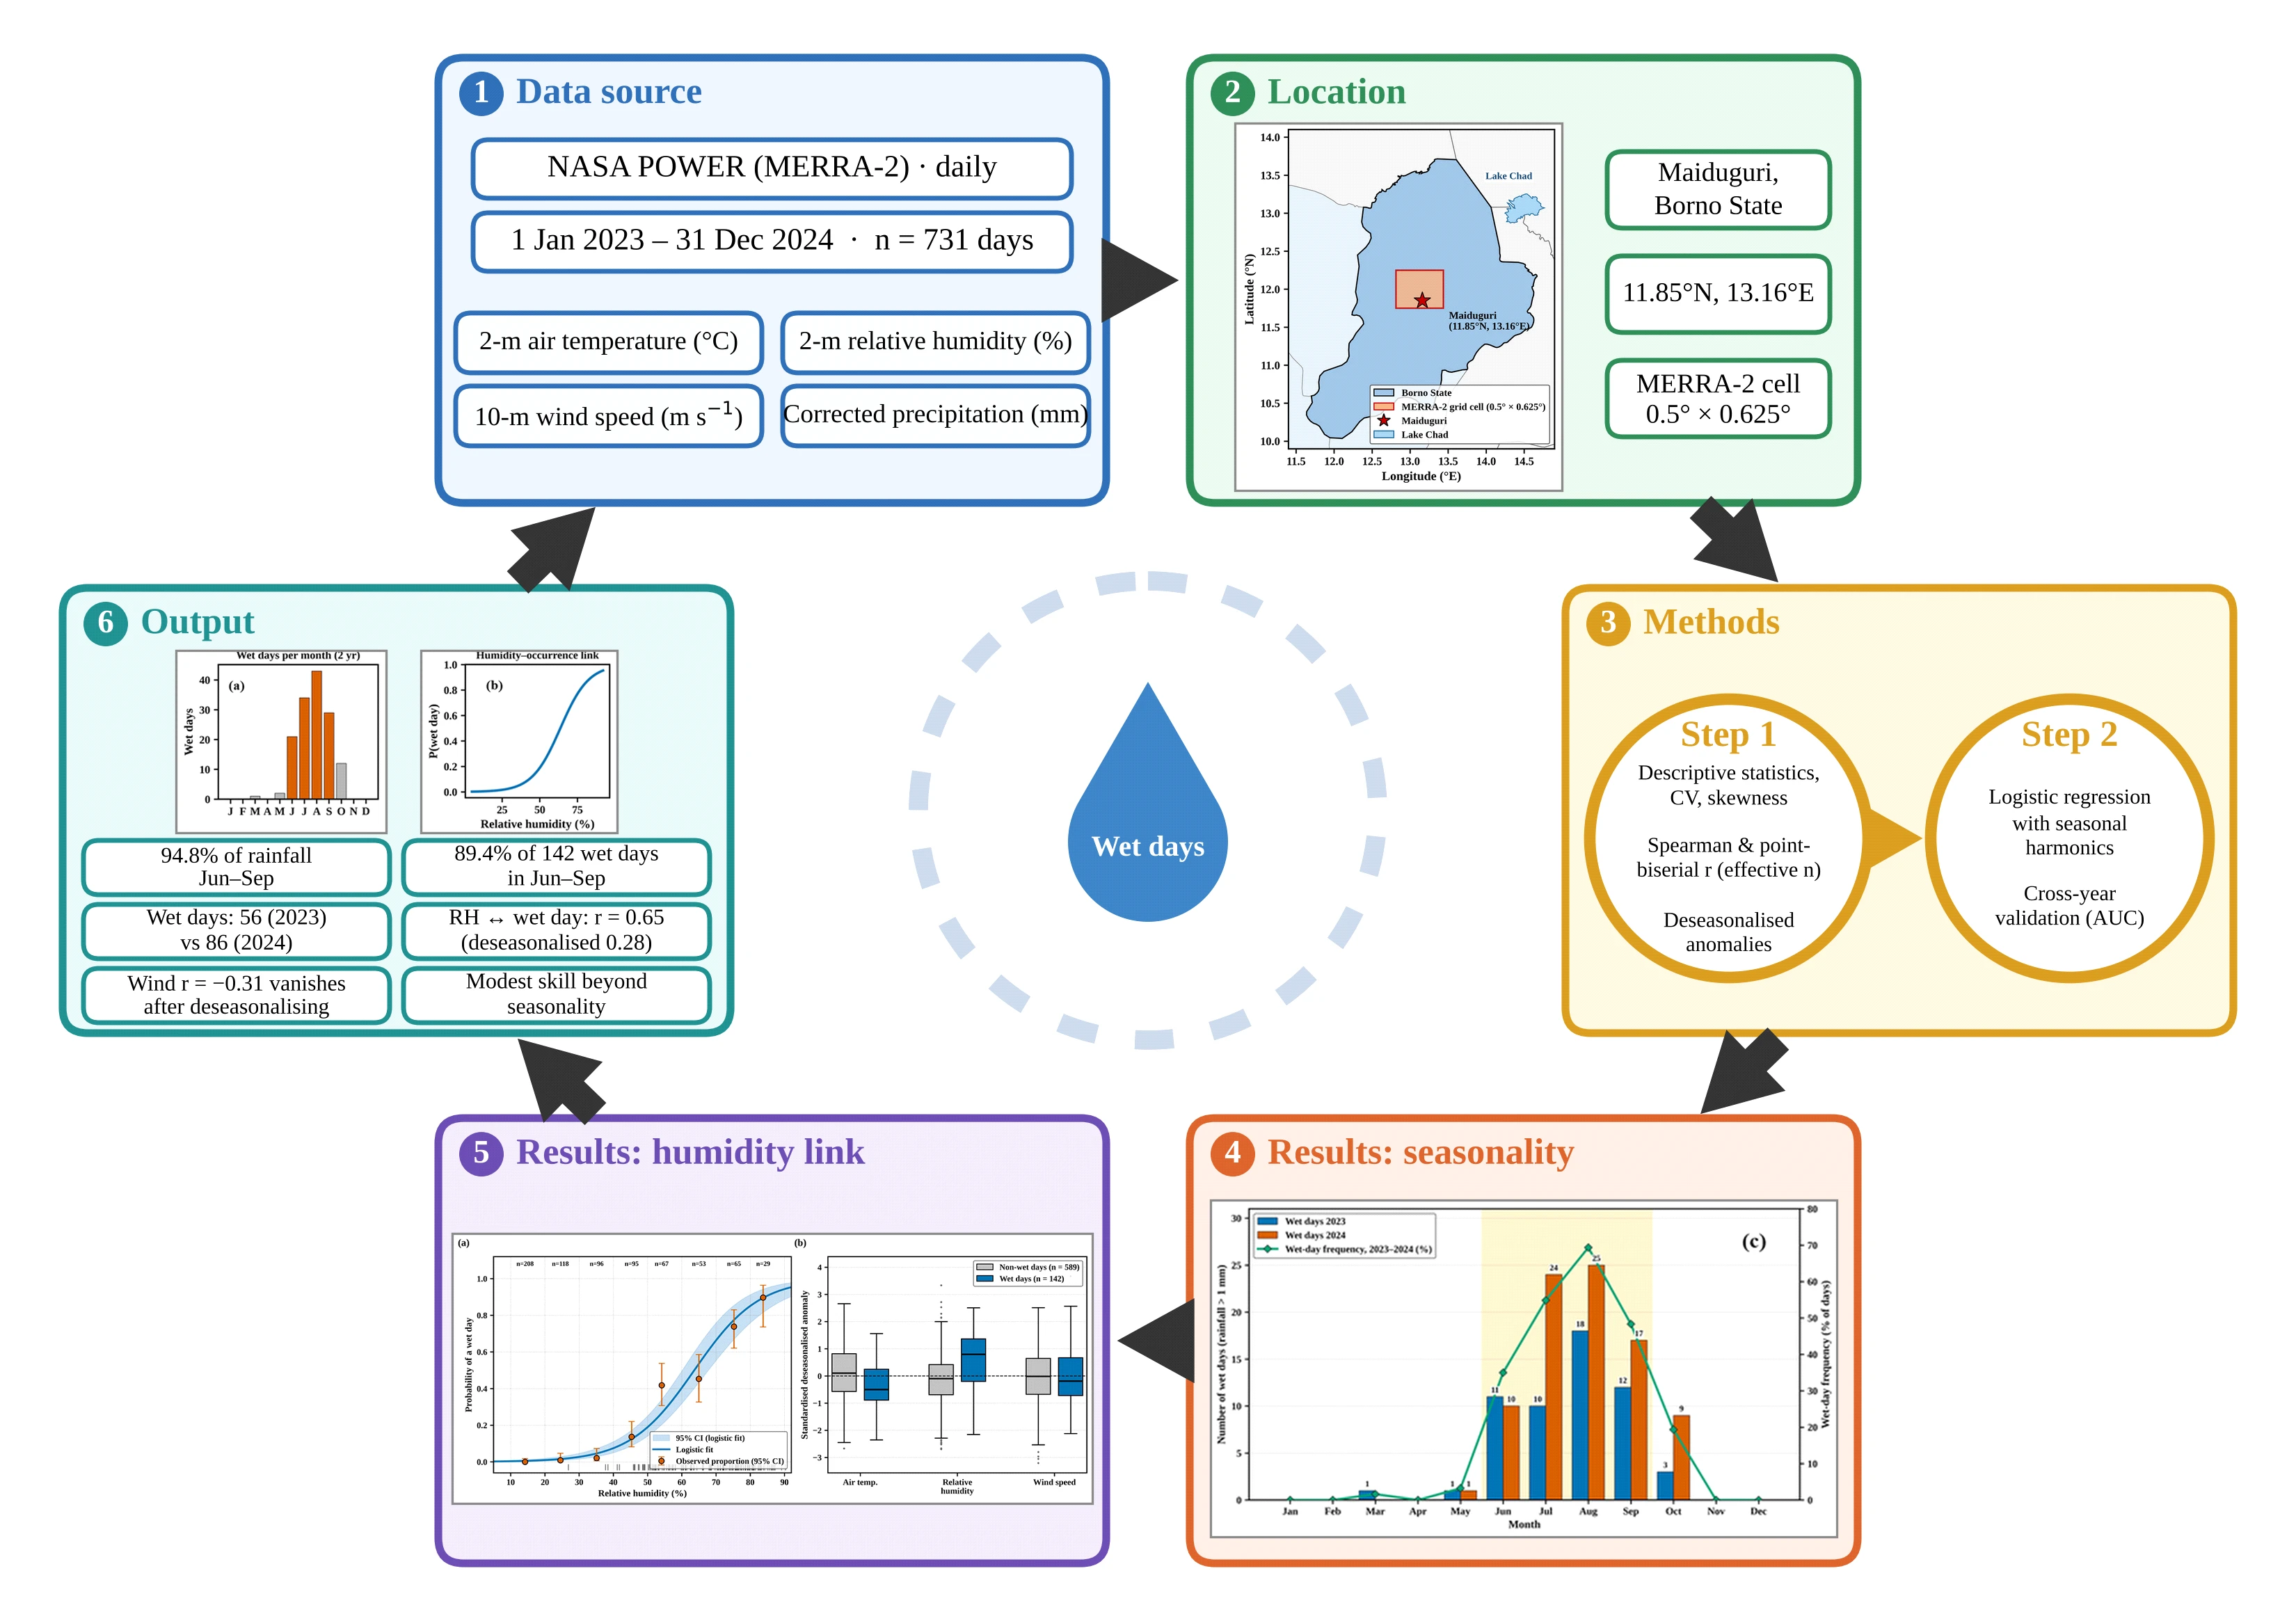
Rainfall in the Sudano-Sahelian zone of northeastern Nigeria is confined to a short monsoon season, yet daily relationships between surface meteorological conditions and rainfall occurrence are rarely documented for Maiduguri. This exploratory two-year (2023–2024) diagnostic study examined surface conditions associated with wet days in Maiduguri using daily NASA POWER (MERRA-2-based) estimates of 2-m air temperature, 2-m relative humidity, 10-m wind speed and precipitation for 2023–2024 with a number of samples (n = 731). A wet day was defined as a day with a daily rainfall exceeding 1 mm, as rainfall alone cannot confirm thunder or lightning, whereas wet days were not treated as thunderstorm events. The methods used included descriptive statistics, Spearman and point-biserial correlations adjusted for serial dependence, correlations of depersonalized anomalies, and logistic regression with seasonal harmonics and cross-year validation. In June–September, 94.8% of the total rainfall and 89.4% of the 142 wet days contribute, and the number of wet days increases from 56 in 2023 to 86 in 2024. Relative humidity showed the strongest association with wet-day occurrence (rpb = 0.65; 95% CI: 0.57–0.72), which weakened but persisted after the seasonal cycle was removed (r = 0.28; 95% CI: 0.17–0.38). The negative wind-speed association (rpb = -0.31) was no longer evident after depersonalization, indicating a shared seasonal pattern instead of a direct physical relationship. Moreover, surface variables provided only marginal improvements in out-of-sample discrimination beyond seasonality. The findings describe associations, not causal effects or a validated warning tool, and justify further work combining station, lightning and upper-air observations.
Keywords
Graphical Abstract
Novelty Statement
This study provides the first daily-scale, seasonality-adjusted diagnostic of surface meteorological conditions associated with wet days in the data-scarce Sudano-Sahelian city of Maiduguri, Nigeria (2023–2024). By analyzing deseasonalized anomalies alongside autocorrelation-robust statistics and cross-year logistic modeling, the research isolates true within-season moisture drivers (such as relative humidity, r = 0.28) from confounding monsoon cycles (such as wind speed, r = −0.31) while quantifying the modest predictive value of surface variables beyond seasonal timing alone. Ultimately, this transparent, reproducible framework establishes a critical local baseline for seasonal preparedness and demonstrates how to responsibly apply gridded satellite products in regions lacking accessible ground-station records.
1. Introduction
Rainfall across the Sudano-Sahelian belt of West Africa falls within a single, short wet season and is dominated by organized convection, particularly mesoscale convective systems and squall lines that supply most of the seasonal total.[1,2] These systems also bring intense short-duration rainfall, strong outflow winds and frequent lightning, as Africa contains several of the world’s most active lightning regions, and extreme Sahelian storms have become more frequent since the early 1980s.[3,4] In northeastern Nigeria, these hazards affect rain-fed livelihoods, transport and poorly drained urban areas.[5,6] Accordingly, deep convection requires low-level moisture, conditional instability and a lifting mechanism.[7] Surface heating destabilizes the boundary layer, and latent heat released during condensation sustains ascent.[8,9] Similarly, thunder and lightning occur when vigorous updrafts in mixed-phase cumulonimbus clouds separate charge through collisions between graupel and ice crystals.[10-12] Daily surface variables therefore describe the near-surface environment of convection but not instability aloft or electrical activity, and a daily rainfall total cannot distinguish a thunderstorm from a stratiform or light monsoon shower. Meteorological observations remain sparse across northern Nigeria, and access to daily station records is often limited by cost and administrative procedures; thus, gridded satellite and reanalysis products are widely used in the Sahel region.[13-15] The NASA Prediction of Worldwide Energy Resources (POWER) service distributes continuous daily variables derived largely from the MERRA-2 reanalysis, but evaluations against Nigerian gauges show that its rainfall reproduces the seasonal cycle more reliably than the day-to-day or interannual variability does.[13,16-18] Furthermore, rainfall studies in northern Nigeria and the wider Sahel have concentrated on long-term totals, trends, onset and the annual migration of the Intertropical Discontinuity (ITD), and recent work on Maiduguri has addressed monthly rainfall forecasting. [19-25] However, less attention has been given to how daily surface conditions covary with rainfall occurrence at the city scale and to whether such associations survive once the shared seasonal cycle and the serial dependence of daily data are considered. This is important because all four variables follow the monsoon cycle; thus, strong correlations can arise even when day-to-day associations are weak. This study therefore provides a short-term, exploratory diagnostic for Maiduguri based on NASA POWER data for 2023–2024. Its objectives were to characterize the distribution and seasonal cycle of air temperature, relative humidity, wind speed, rainfall and wet-day occurrence in each year; to quantify the associations between these variables and rainfall occurrence; to separate seasonal from within-season coverability; and to assess whether the surface variables add information on wet-day occurrence beyond seasonal timing. The novelty lies in this daily scale, seasonality-adjusted treatment, in which associations are evaluated after the shared seasonal cycle is removed, with allowance for serial dependence and cross-year validation, which are steps not usually taken in local descriptive rainfall studies of northeastern Nigeria. Given that only rainfall was available, the outcome is defined as rainfall-defined wet days rather than thunderstorms, and no long-term trends are inferred.
2. Study area
Maiduguri (11.85°N, 13.16°E, approximately 350 m above sea level), the capital of Borno state, lies in the Lake Chad Basin near the borders with Niger, Chad and Cameroon, as shown in Fig. 1.[16] The city has a hot semiarid climate (Köppen BSh), with a single rainy season, normally June–September, which is controlled by the northward advance and retreat of the ITD within the West African Monsoon (WAM).[26-28] The rest of the year is dominated by dry north-easterly Harmattan flow. The terrain is flat, with sparse vegetation and seasonal drainage channels.
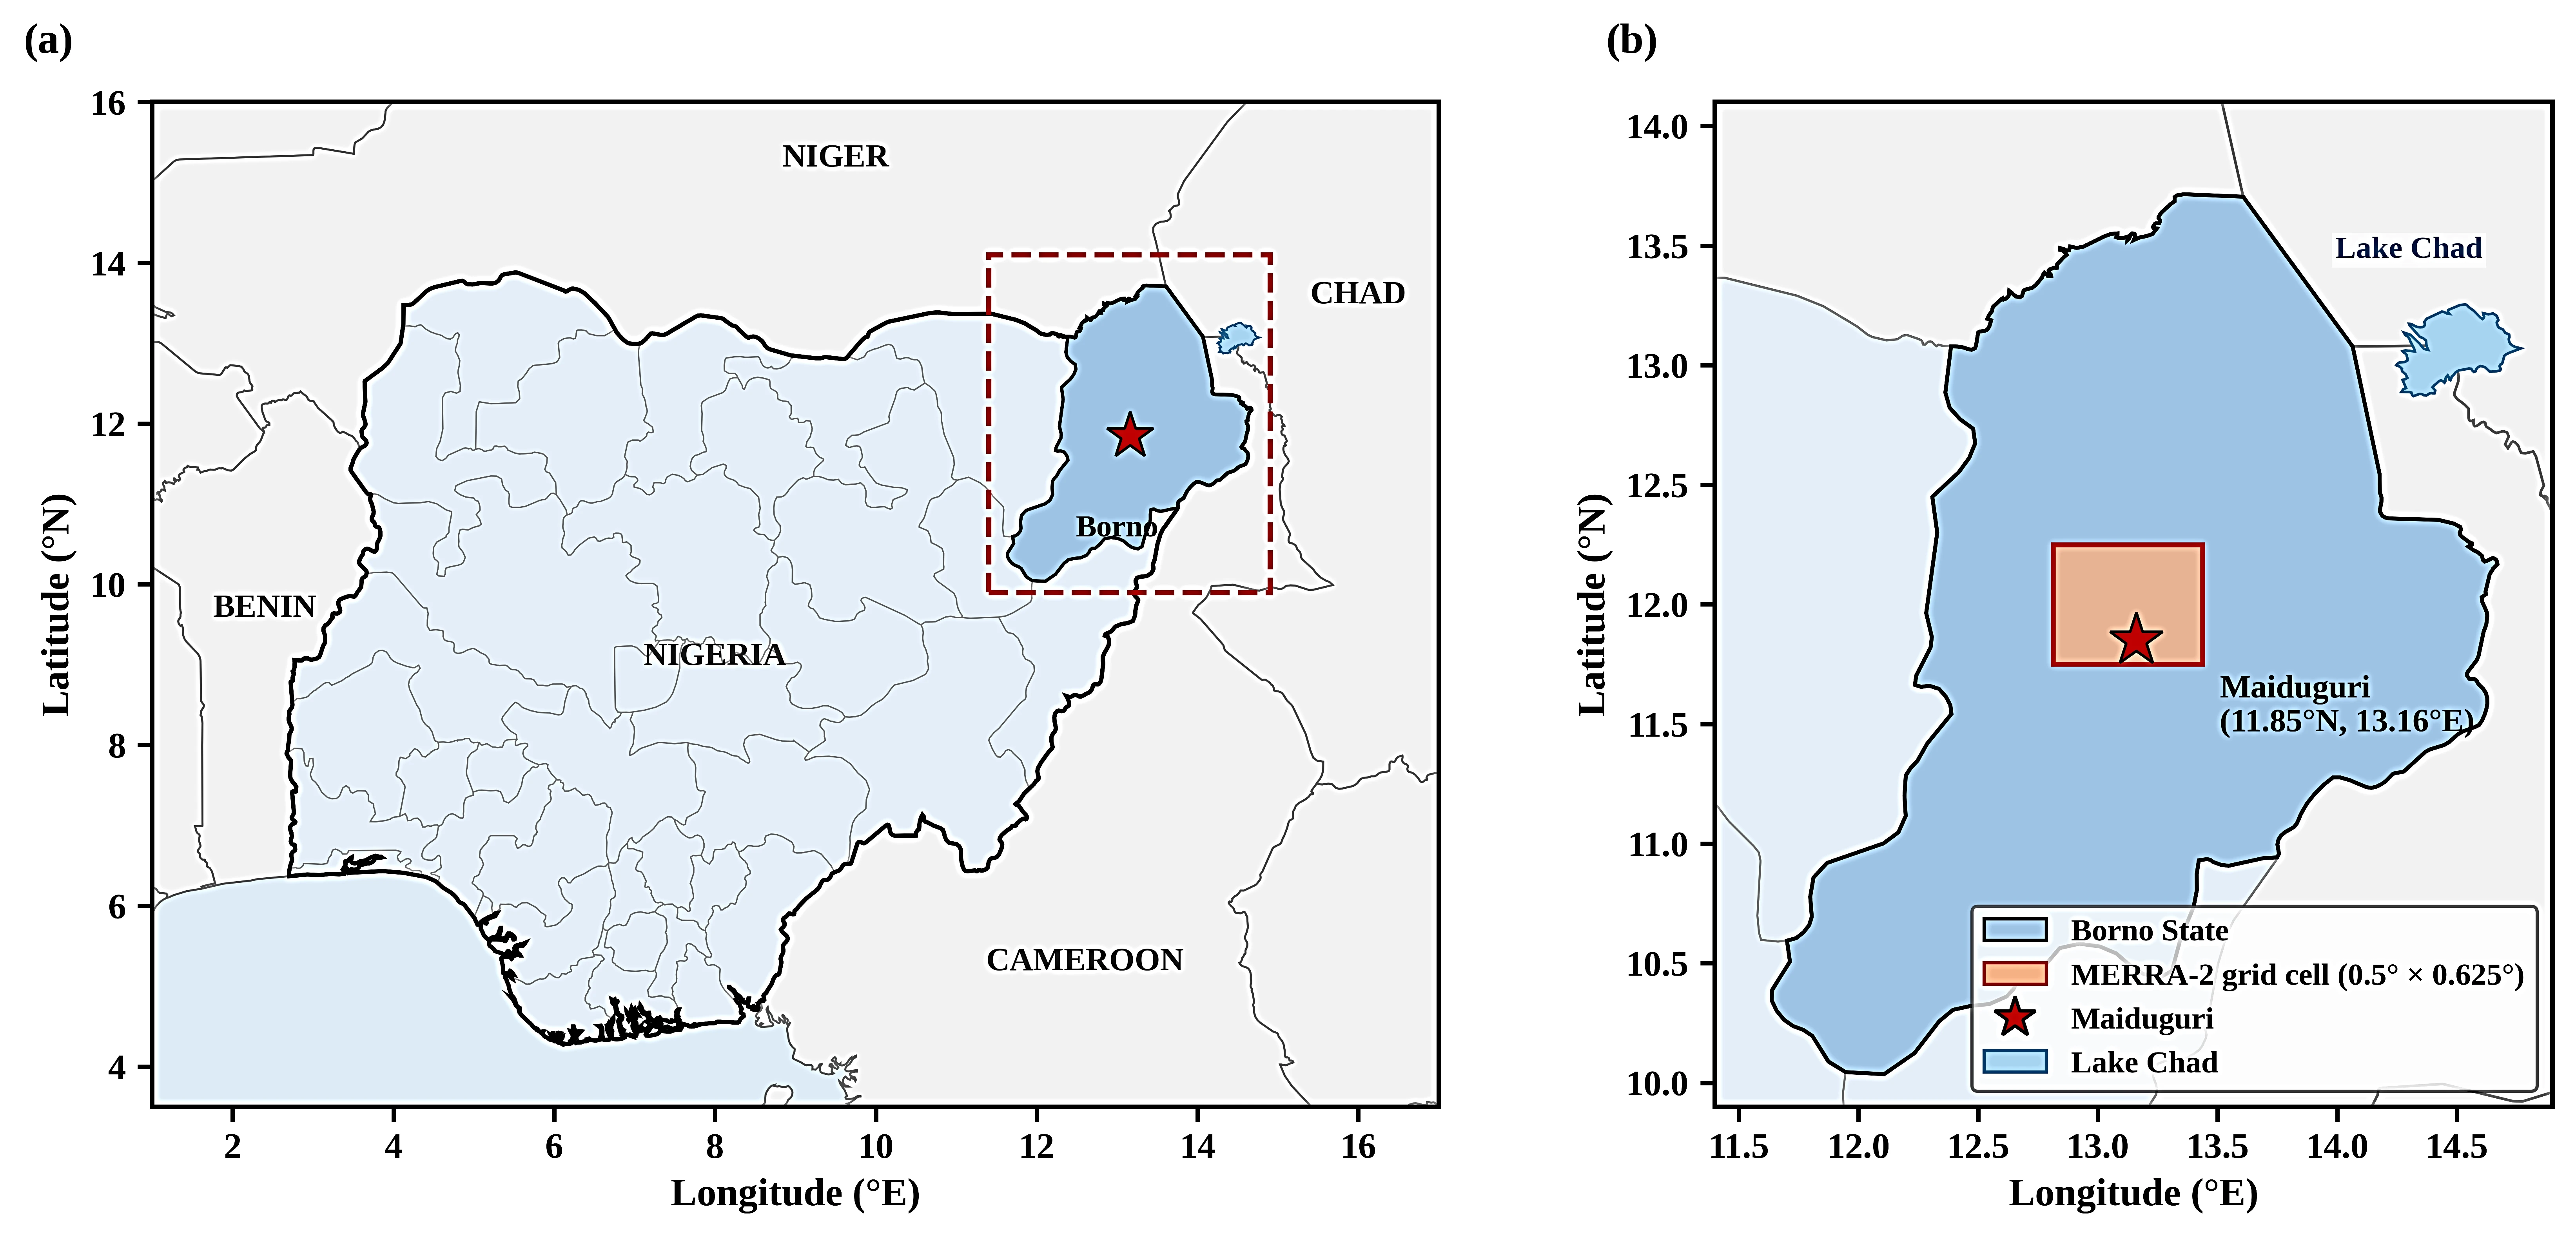
Fig. 1:Study area sowing (a) Nigeria and Borno State in West Africa, (b) Borno State, showing Maiduguri and the MERRA-2 grid cell (0.5° × 0.625°) containing the NASA POWER extraction point.
3. Materials and methods
3.1 Data source and processing
Daily data for 1 January 2023 to 31 December 2024 were retrieved on 7 September 2026 from the NASA POWER Data Access Viewer (https://power.larc.nasa.gov) for the point 11.85°N, 13.16°E.[29] The parameters were T2M (air temperature at 2 m, °C), RH2M (relative humidity at 2 m, %), WS10M (wind speed at 10 m, m s−1) and PRECTOTCORR (bias-corrected precipitation, mm day−1). All four variables are derived from MERRA-2, whose native grid is 0.5° × 0.625°, and the precipitation is from gauge- and satellite-based observations over land. [17,30] The values are therefore grid-cell averages shown in Fig. 1b from the extraction point and not station measurements. The 731-day record contained no missing dates, duplicates or physically implausible values, and no gap filling or bias correction was applied. Python 3 (pandas, SciPy, stats models and scikit-learn) was used for the analysis.
3.2 Representativeness of the NASA POWER data
NiMet (Nigerian Meteorological Agency) records for Maiduguri were not freely available for 2023–2024; therefore, data quality was assessed from published evaluations. At the NiMet Maiduguri station, POWER monthly rainfall for 1981–2015 correlated moderately with gauge records (r = 0.59; RMSE = 50.1 mm month−1), whereas annual totals were essentially uncorrelated (r = 0.02), as reported by Dawa et al. (2024).[16] Moreover, a study by Ellis & Samson (2026) revealed that across 20 NiMet stations, POWER reproduced spatial and seasonal rainfall patterns but overestimated the frequency of light-rain days and underestimated wet-day intensity.[9] POWER air temperatures coincide with NiMet observations in northern Nigeria, and global station comparisons reveal modest daily skill for precipitation (NASA POWER Project, n.d.).[31] The data are therefore most dependable for the seasonal cycle and relative contrasts and least dependable for exact daily amounts and interannual totals.
3.3 Wet days
A wet day was defined as a day with rainfall exceeding 1 mm, which is consistent with the 1-mm wet-day convention of climate indices.[32] The threshold excludes the trace amounts that reanalysis products generate on many otherwise dry days, whereas in this record, 165 days had more than 0 mm but no more than 1 mm.[13] Wet-season rainfall in the Sudano-Sahel Basin is mainly convective, but the threshold also captures stratiform and light rain and has no information on thunder or lightning; thus, wet days are treated only as rainfall-occurrence days.[2,33] Sensitivity was tested with thresholds of 0.1, 2.5 and 5 mm and with ≥ 1 mm.
3.4 Statistical analysis
Descriptive statistics included the mean, sample standard deviation (n − 1 denominator), coefficient of variation (CV = SD/mean × 100), quartiles, extremes and skewness, and normality was checked with the Shapiro‒Wilk test. The monthly means, rainfall totals and wet-day counts were computed for each year, and the seasonal shares were calculated separately for the rainfall amount and wet-day frequency. As daily rainfall was strongly skewed and zero-inflated, associations among continuous variables were measured with Spearman’s rank correlation (ρ), with Pearson’s r reported for comparison. The point-biserial coefficient (rpb) is used to determine the associations with the binary wet-day series.[34] Daily meteorological series are serially correlated, which inflates nominal significance, while confidence intervals (Fisher z) and p values are therefore based on an effective sample size:[35] neff=n (1 - ρ1,x ρ1,y)(1 + ρ1,x ρ1,y) (1) where ρ1,x and ρ1,y are the lag-1 autocorrelations of the two series. To separate seasonal from within-season coverability, each variable was deseasonalized by subtracting a three-harmonic fit to the day of the year, and the correlations were recomputed on the anomalies. Wet-day occurrence was modeled with logistic regression.[36] Model M1 contained only two seasonal harmonics; M2 included same-day temperature, relative humidity (per 10 percentage points) and wind speed; and M3 used previous-day values of the same variables, as same-day means are partly altered by rain. Standard errors were autocorrelated with the Newey‒West estimator and a 7-day lag.[37] The models were compared using likelihood ratio tests, the Akaike information criterion (AIC) and the area under the receiver operating characteristic curve (AUC), and out-of-sample skill was assessed by fitting each model to one year and testing it on the other. Statistical significance was set at p < 0.05.
4. Results and discussion
4.1 Distribution of surface meteorological variables
Table 1 summarizes the 731 daily values. Rainfall was the most variable and least normally distributed parameter (CV = 306%, skewness = 5.22); the median was 0.00 mm, only 142 days (19.4%) were wet, and the 24 days with more than 10 mm supplied half of the two-year total. Among the remaining variables, relative humidity had the greatest relative variability (CV = 58.0%), reflecting the contrast between Harmattan and monsoon air, whereas temperature varied the least (CV = 14.9%). Shapiro‒Wilk tests rejected normality for all four variables (p < 0.001), supporting the use of rank-based and model-based methods. This episodic regime is typical of the Sudano–Sahelian zone.[24,38] However, because NASA POWER tends to underestimate heavy daily totals, the maximum of 37.75 mm is seen as probably a conservative estimate of local extremes.[13,16]
4.2 Seasonal cycle and interannual contrast
The seasonal cycle presented in Table 2 and illustrated in Fig. 2, Fig. 3 and Fig. 4 follows the WAM. June–September supplied 878.9 mm of the 926.6 mm two-year total of 94.8% and 127 of the 142 wet days with 89.4%, two percentages that measure different quantities. August was the wettest month in both years, with 43 wet days over the two years (69.4% of August days), followed by July, with 34 days. However, the temperature peaks in May (two-year mean of 35.4 °C), before regular rainfall begins, and then decreases as the cloud cover and evaporative cooling increase.[23] However, the two-year mean relative humidity increased from approximately 13% in March to 73% in August, whereas the mean wind speed decreased to a September minimum and strengthened again with the return of Harmattan.
Table 1: Descriptive statistics of daily surface variables in Maiduguri, 2023–2024 (n = 731)
| Statistic | Air temperature (°C) | Relative humidity (%) | Wind speed (ms−1) | Rainfall (mm) |
|---|---|---|---|---|
| Mean | 29.10 | 38.19 | 2.67 | 1.27 |
| Standard deviation | 4.33 | 22.15 | 0.89 | 3.88 |
| Coefficient of variation (%) | 14.9 | 58.0 | 33.4 | 306.5 |
| Minimum | 18.81 | 6.87 | 0.45 | 0.00 |
| 25th percentile | 25.96 | 18.29 | 1.99 | 0.00 |
| Median | 29.06 | 34.39 | 2.68 | 0.00 |
| 75th percentile | 32.47 | 53.21 | 3.29 | 0.53 |
| Maximum | 38.49 | 90.28 | 5.07 | 37.75 |
| Skewness | −0.09 | 0.53 | 0.19 | 5.22 |
**Note: SD is the sample standard deviation (n − 1 denominator); CV = SD/mean × 100. Skewness is the adjusted Fisher–Pearson coefficient.
Table 2: Monthly mean temperature, relative humidity and wind speed, monthly rainfall totals and wet days (> 1 mm) in Maiduguri, 2023 and 2024
| Month | Air temperature (°C) | Relative humidity (%) | Wind speed (m s−1) | Rainfall (mm) | Wet days | |||||
|---|---|---|---|---|---|---|---|---|---|---|
| 2023 | 2024 | 2023 | 2024 | 2023 | 2024 | 2023 | 2024 | 2023 | 2024 | |
| January | 24.2 | 22.9 | 22.1 | 17.7 | 3.10 | 3.10 | 0.0 | 0.0 | 0 | 0 |
| February | 26.0 | 26.6 | 16.8 | 17.0 | 3.73 | 3.41 | 0.0 | 0.2 | 0 | 0 |
| March | 30.6 | 33.0 | 14.7 | 11.9 | 3.31 | 3.50 | 1.4 | 0.0 | 1 | 0 |
| April | 33.9 | 35.0 | 19.9 | 12.8 | 2.86 | 2.59 | 0.9 | 0.1 | 0 | 0 |
| May | 34.5 | 36.4 | 34.6 | 25.5 | 2.81 | 2.50 | 10.3 | 3.0 | 1 | 1 |
| June | 31.5 | 33.7 | 51.6 | 43.9 | 2.26 | 2.72 | 63.1 | 44.0 | 11 | 10 |
| July | 31.9 | 29.1 | 50.0 | 65.7 | 2.30 | 2.33 | 39.4 | 194.8 | 10 | 24 |
| August | 28.9 | 26.2 | 65.0 | 81.4 | 1.74 | 2.60 | 162.1 | 227.4 | 18 | 25 |
| September | 29.5 | 27.1 | 62.3 | 77.0 | 1.81 | 1.34 | 56.1 | 92.0 | 12 | 17 |
| October | 30.3 | 27.5 | 40.7 | 60.2 | 2.04 | 1.86 | 9.8 | 21.9 | 3 | 9 |
| November | 29.5 | 23.5 | 28.0 | 39.9 | 2.94 | 3.09 | 0.1 | 0.0 | 0 | 0 |
| December | 24.6 | 21.9 | 22.4 | 32.9 | 3.07 | 3.16 | 0.0 | 0.0 | 0 | 0 |
| Annual | 29.6 | 28.6 | 35.8 | 40.6 | 2.66 | 2.68 | 343.1 | 583.5 | 56 | 86 |
| Jun–Sep share (%) | – | – | – | – | – | – | 93.4 | 95.7 | 91.1 | 88.4 |
**Note: The annual values are annual means (temperature, humidity, and wind speed) or annual totals (rainfall and wet days). The two-year totals are 926.6 mm and 142 wet days, of which June–September account for 94.8% and 89.4%, respectively.
This sequence is consistent with the northward migration of the ITD, which brings deep southwesterly monsoon moisture to the far north of Nigeria only in mid-summer and reaches its northernmost position in approximately August.[22,27] Within this moist layer, rainfall is delivered mainly by organized systems that are often modulated by African easterly waves.[2,39] Hence, the rainfall frequency and peak amount are greater in August than in April–May. The two years differed markedly, as 2024 had 86 wet days and 583.5 mm of rainfall, compared with 56 wet days and 343.1 mm in 2023, mostly because of a wetter July–October, as presented in Table 2 and as shown in Figs. 3 and Fig. 4. However, with two years, this contrast reflects interannual variability, which is large in the Sahel, which does not reflect a trend.[19,21] The totals are of the same order as gauge evidence for far northeastern Nigeria, where the mean wet-season rainfall is less than 500 mm and rain occurs approximately 35 days per season.[13] The higher POWER wet-day counts for June–September (51 in 2023 and
76 in 2024) are consistent with the tendency of POWER to overestimate rainfall frequency even after the 1-mm threshold is applied considering the size of the interannual difference.[16]
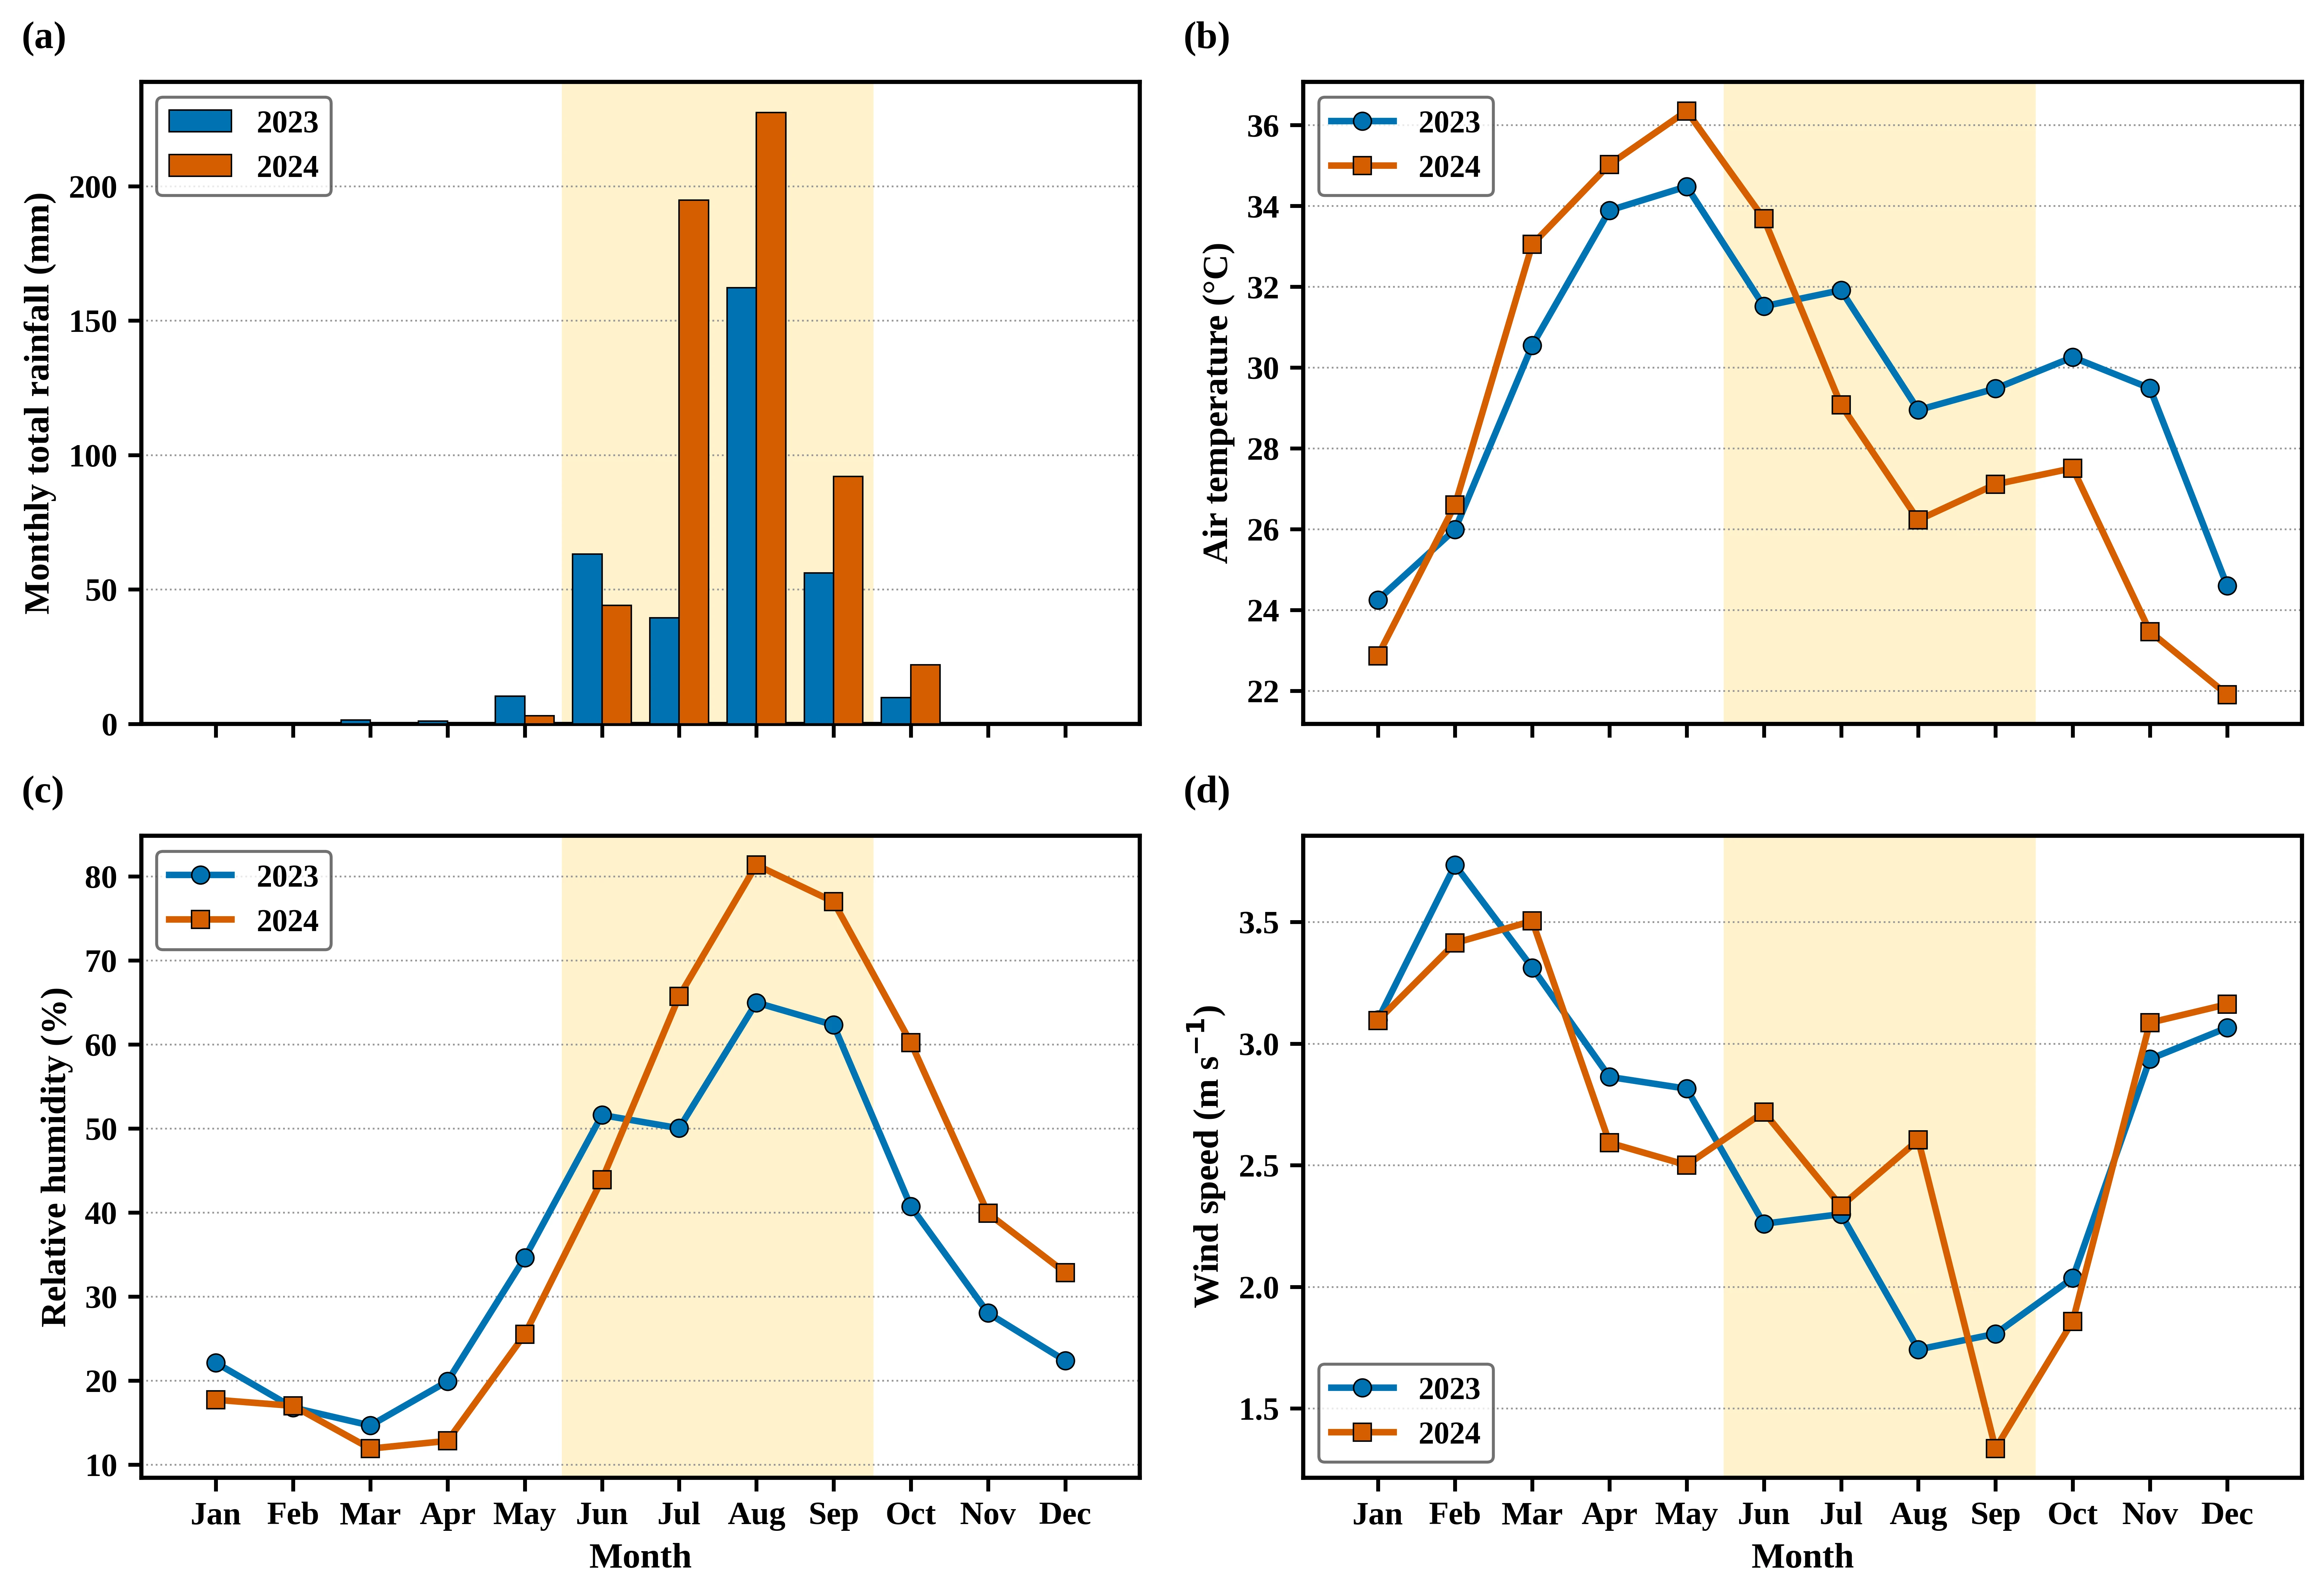
Fig. 2:Monthly (a) total rainfall and mean (b) air temperature, (c) relative humidity and (d) wind speed for 2023 and 2024. The shading indicates June–September.
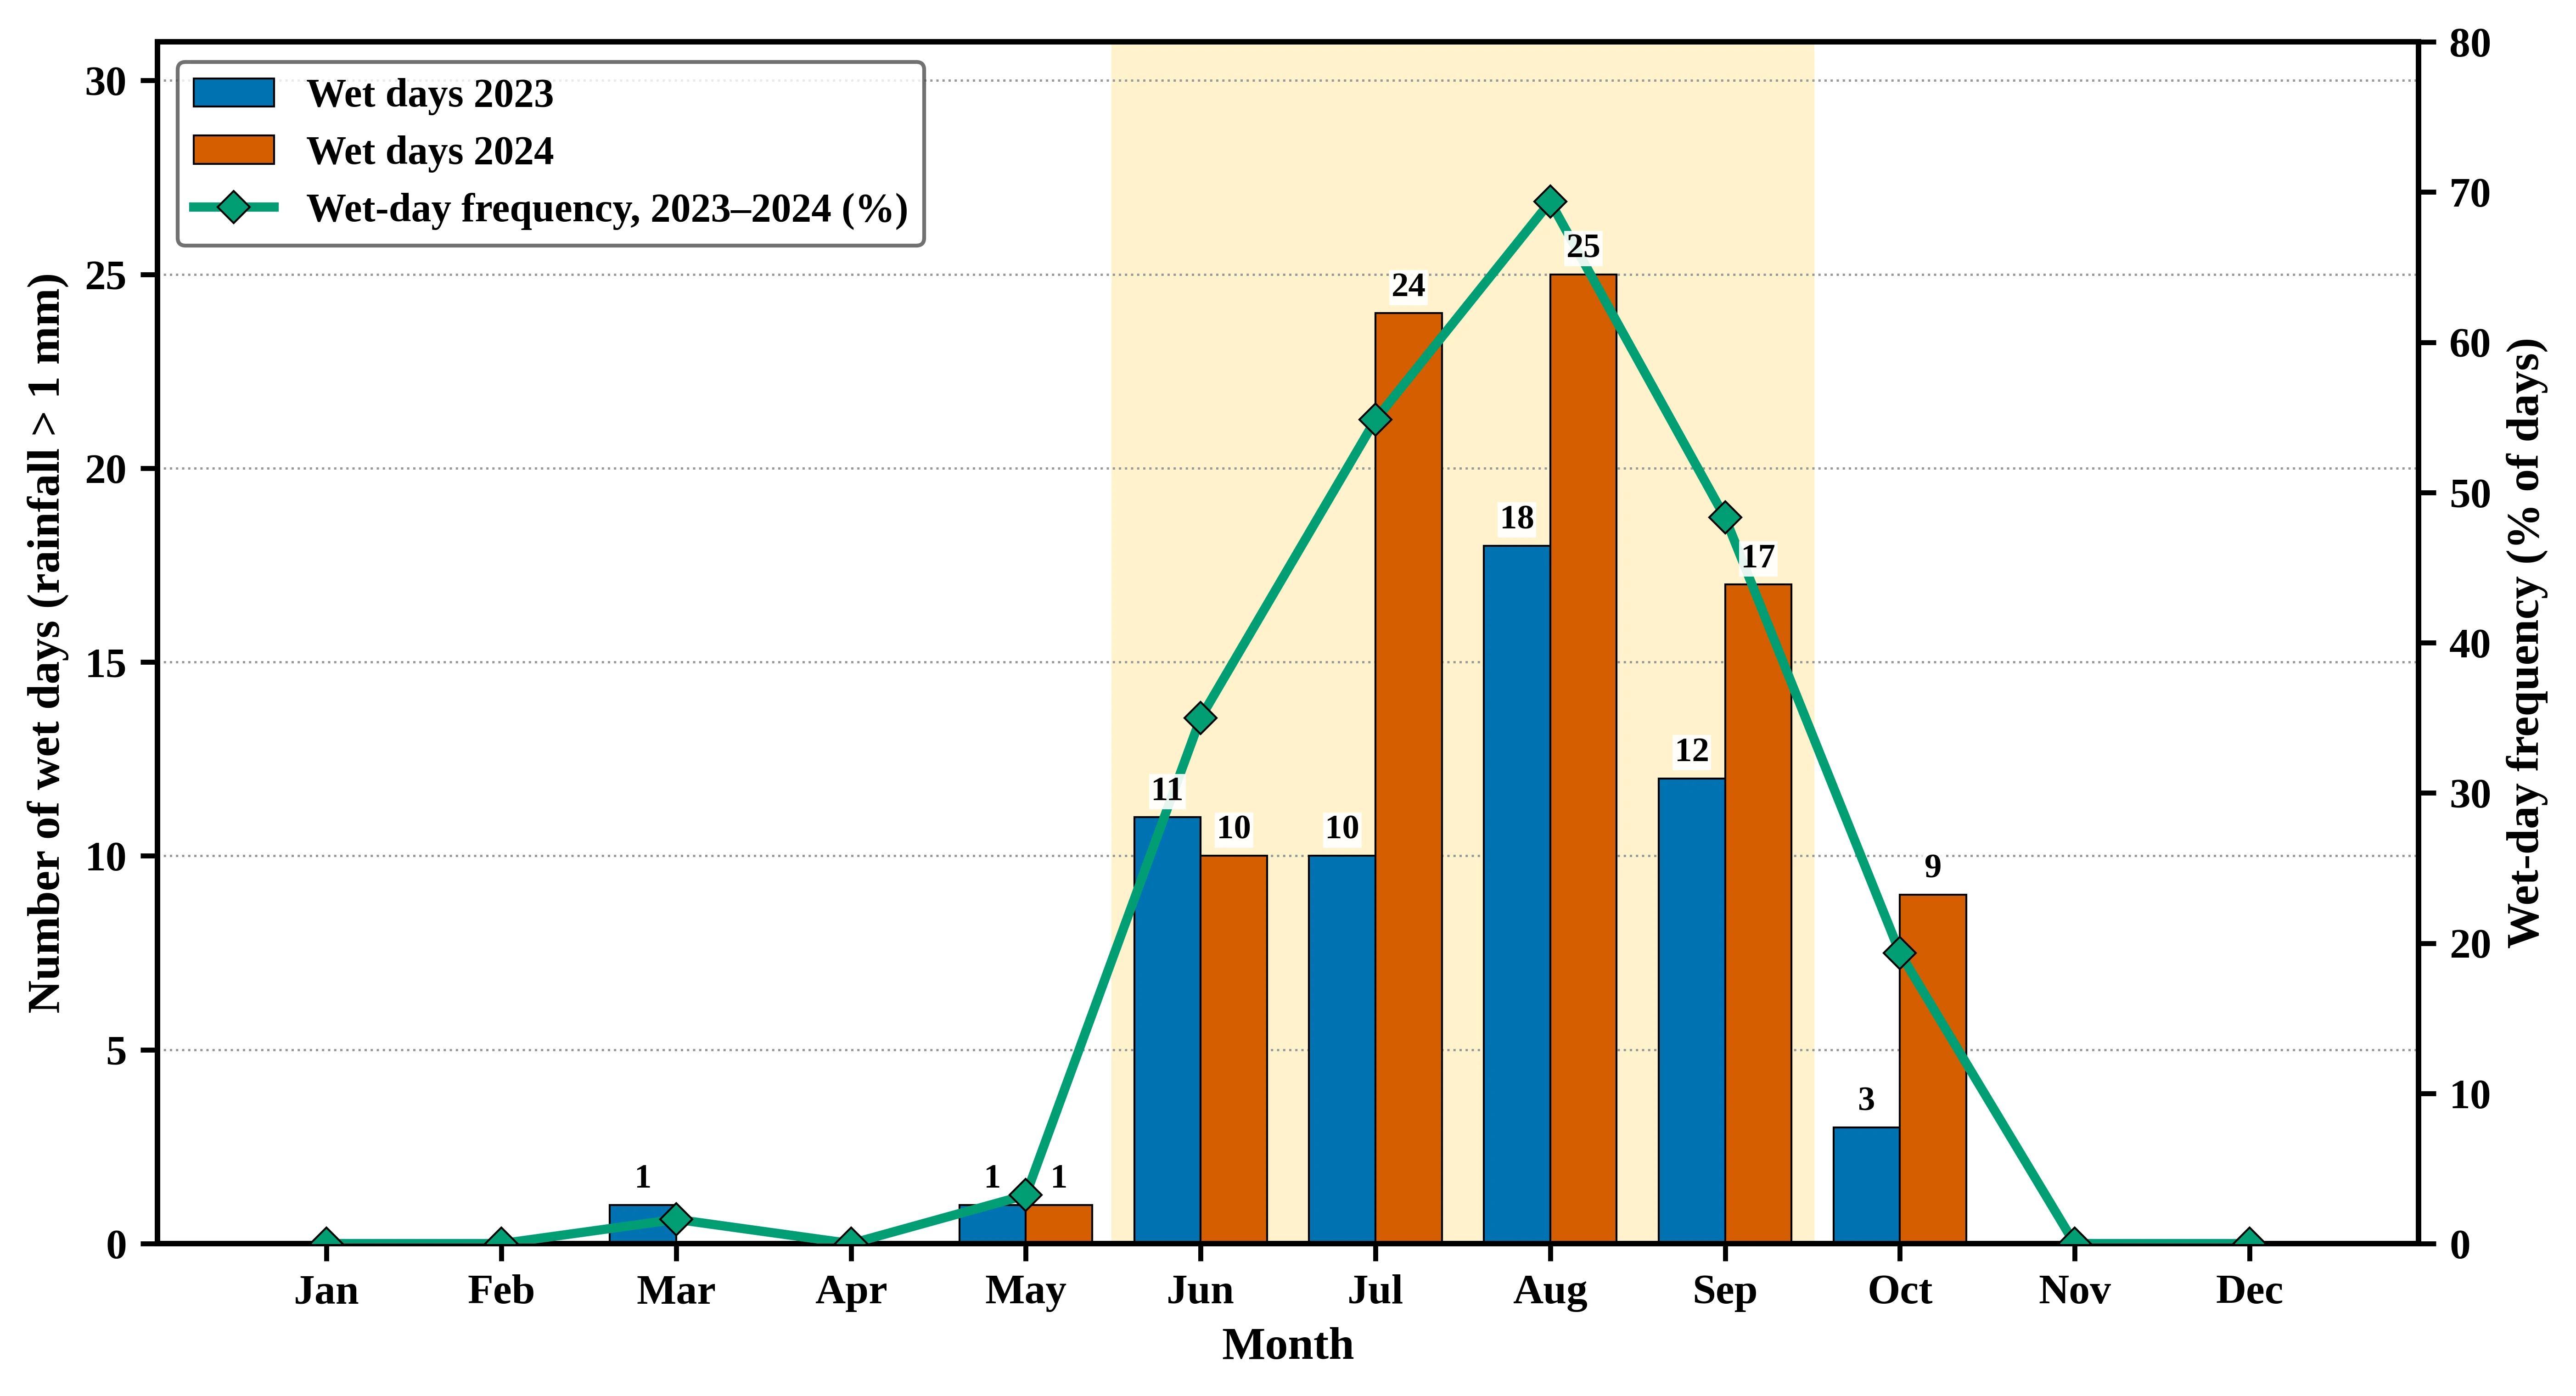
Fig. 3:Monthly wet days (rainfall > 1 mm) in 2023 and 2024 (bars) and two-year wet-day frequency as a percentage
of days (line). The shading indicates June–September.
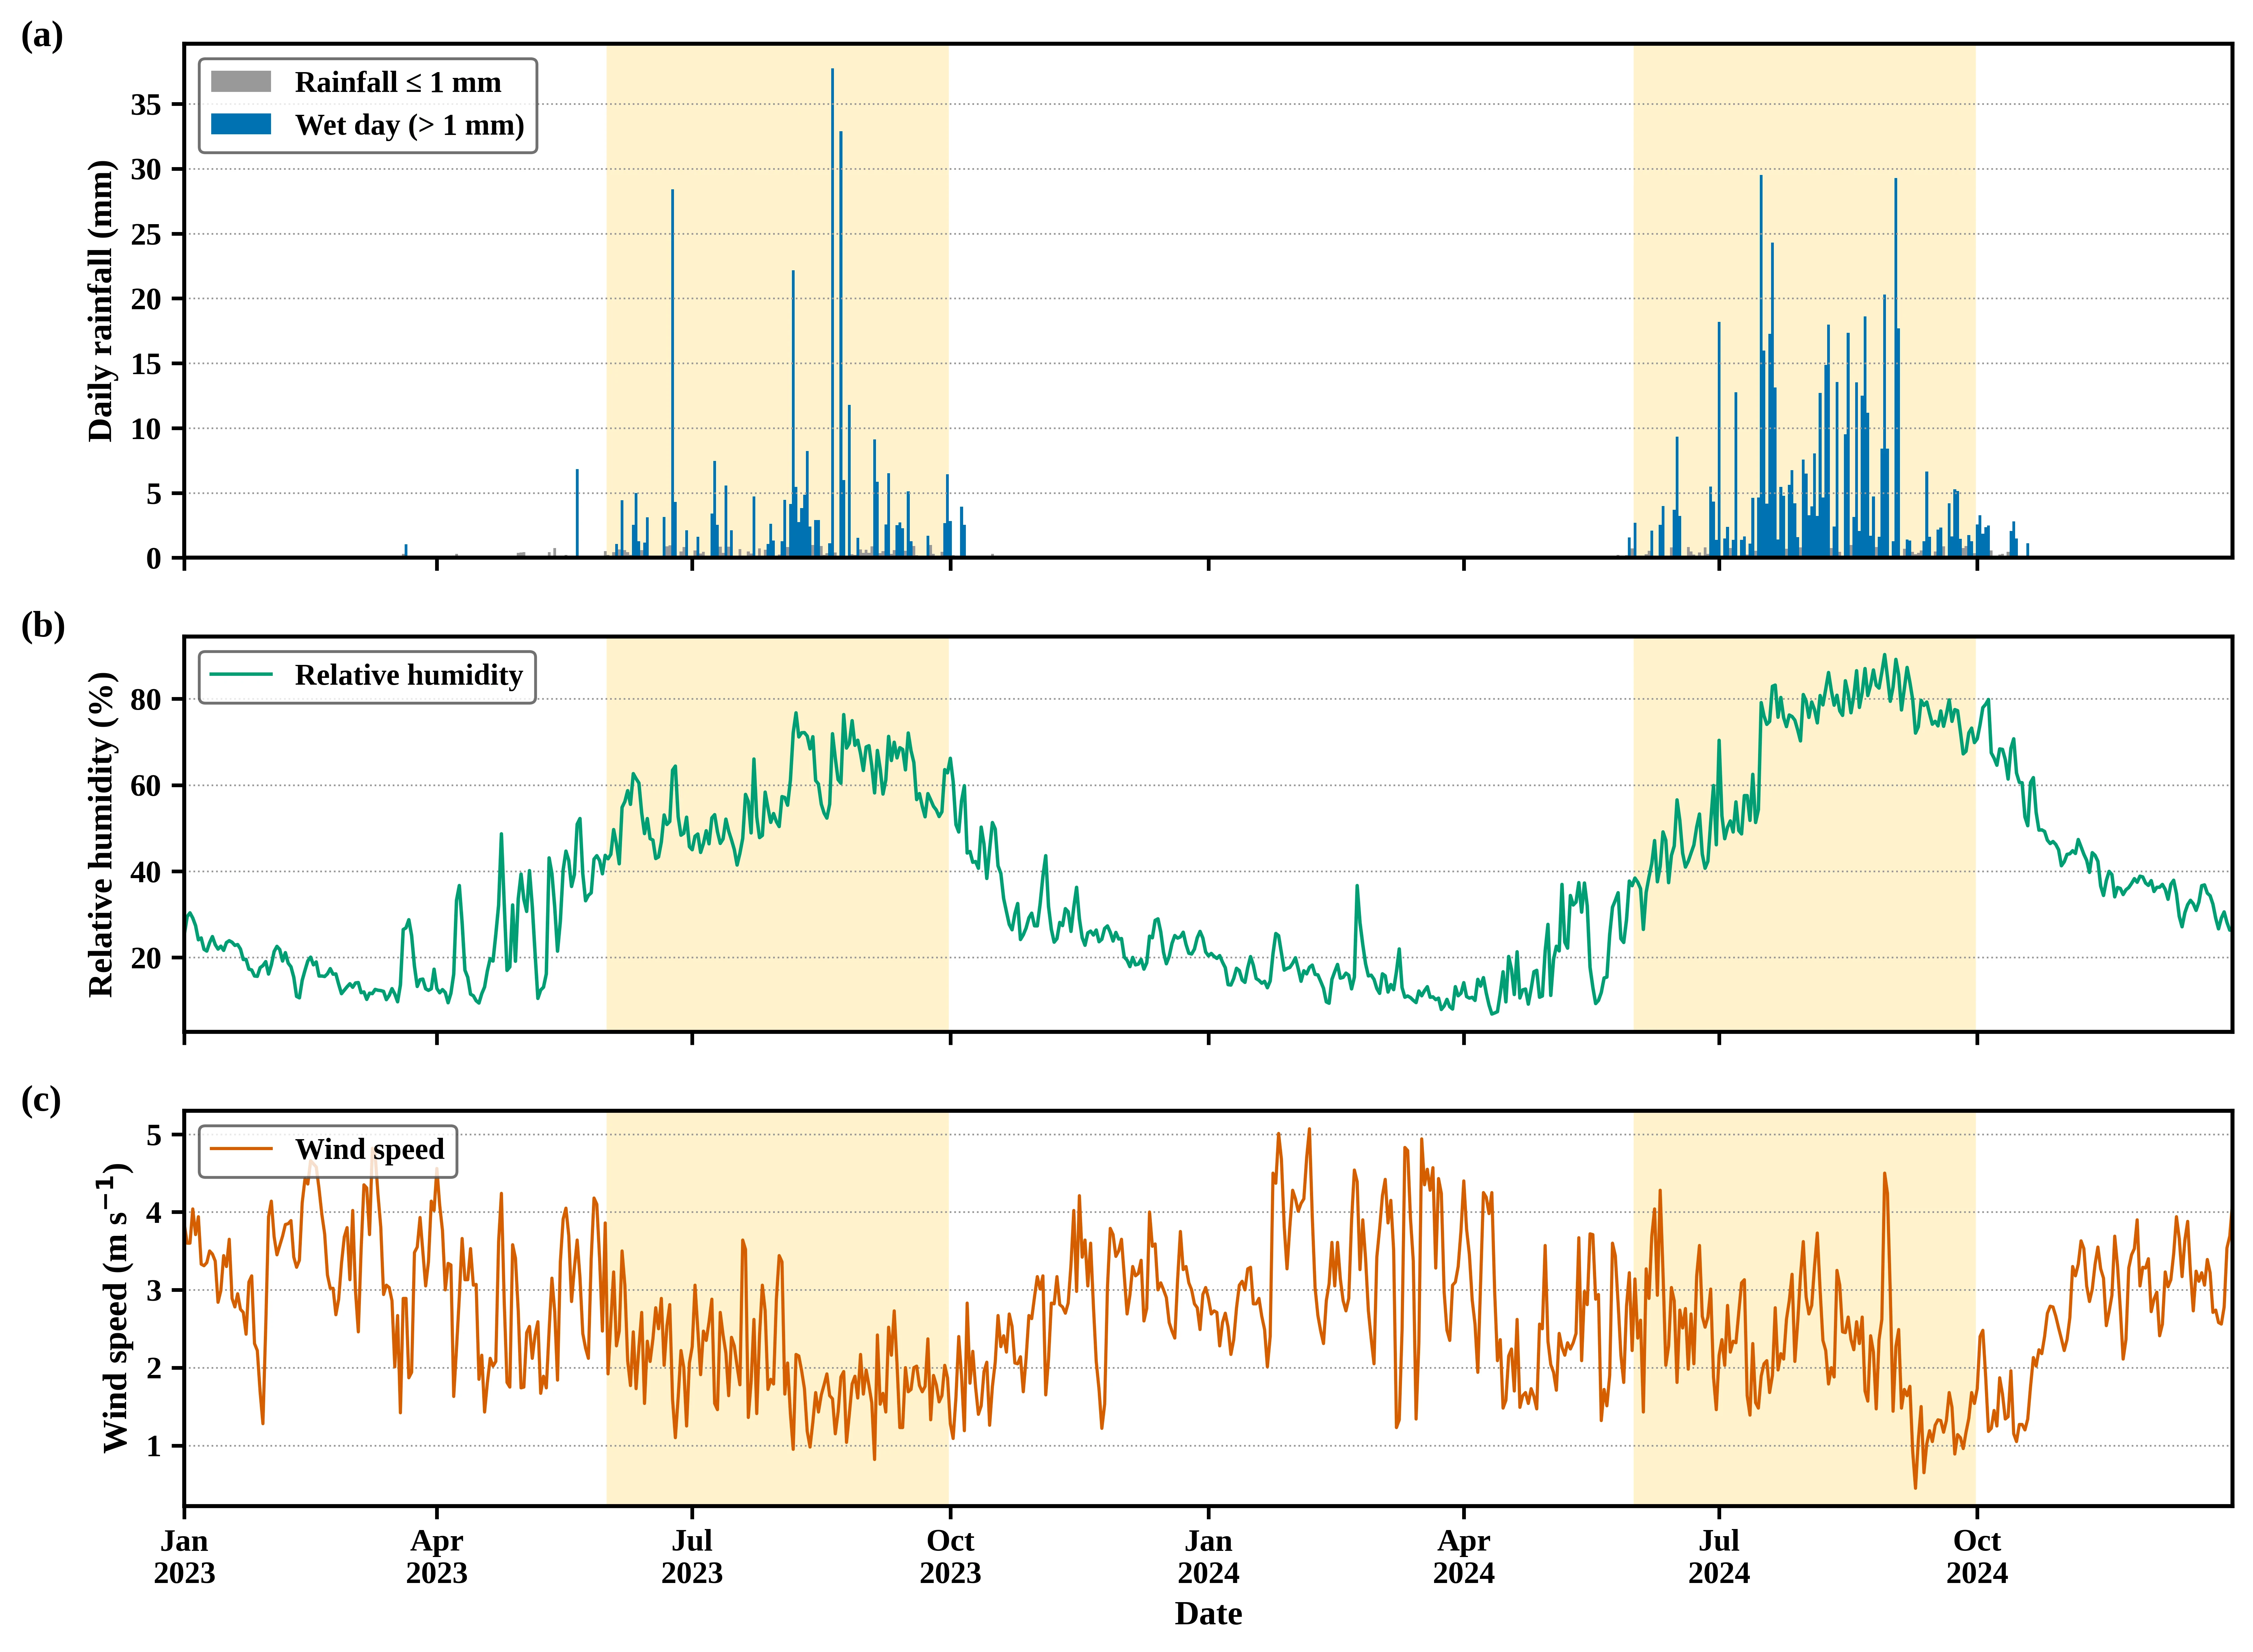
Fig. 4:Daily (a) rainfall, with wet days (> 1 mm) highlighted, (b) relative humidity and (c) wind speed, 2023–2024. The shading indicates June–September.
4.3 Associations between surface variables and rainfall occurrence
The correlations among the continuous variables where relative humidity was positively associated with daily rainfall are shown in Table 3, and the correlation (ρ = 0.80) was much stronger than the Pearson coefficient (r = 0.49), reflecting the skewed, zero-inflated rainfall distribution. The temperature‒humidity correlation was neff = 21 (p = 0.55). After deseasonalization, the humidity‒rainfall association decreased to ρ = 0.29 but remained significant, whereas the wind‒rainfall correlation became weakly positive (ρ = 0.09) and the temperature‒rainfall correlation became negative (ρ = −0.23).
Table 3: Correlations among daily surface variables before and after removal of the seasonal cycle (n = 731)
| Variable pair | Raw daily values | Deseasonalized anomalies | ||||
|---|---|---|---|---|---|---|
| Pearson r | Spearman ρ [95% CI] | neff | p | Spearman ρ [95% CI] | p | |
| Temperature-relative humidity | −0.12 | −0.14 (−0.54, 0.31) | 21 | 0.551 | −0.59 (−0.70, −0.46) | < 0.001 |
| Temperature-wind speed | −0.17 | −0.17 (−0.34, 0.01) | 115 | 0.065 | −0.10 (−0.23, 0.02) | 0.112 |
| Temperature-rainfall | −0.08 | 0.11 (0.00, 0.21) | 344 | 0.040 | −0.23 (−0.30, −0.15) | < 0.001 |
| Relative humidity-wind speed | −0.50 | −0.48 (−0.61, −0.33) | 115 | < 0.001 | 0.13 (0.01, 0.25) | 0.037 |
| Relative humidity-rainfall | 0.49 | 0.80 (0.76, 0.84) | 343 | < 0.001 | 0.29 (0.22, 0.37) | < 0.001 |
| Wind speed-rainfall | −0.19 | −0.45 (−0.52, −0.37) | 413 | < 0.001 | 0.09 (0.01, 0.17) | 0.026 |
**Note: Confidence intervals (Fisher z) and p values use the effective sample size neff as in Eq. 1. Anomalies depart from a three-harmonic seasonal fit; neff for anomalies ranged from 124 to 603.
Table 4 presents associations with wet-day occurrence, where relative humidity had the strongest association (rpb = 0.65, 95% CI, 0.57–0.72), wind speed had a moderate negative association (rpb = −0.31) and temperature did not (rpb = −0.0, p = 0.47). The observed probability of a wet day was less than 3% when the humidity was less than 40% and approximately 90% when it exceeded 80%, as illustrated in Fig. 5a; however, after the removal of the seasonal cycle, the humidity association weakened to r = 0.28 (95% CI, 0.17–0.38) but persisted, the temperature association became negative (r = −0.19), and the wind association was no longer evident (r = −0.01, p = 0.90), as shown in Fig. 5b. The results were similar for thresholds of 0.1–5 mm (humidity rpb = 0.77–0.44).
Table 4: Associations between surface variables and wet-day occurrence (142 wet and 589 nonwet days)
| Predictor | rpb (95% CI) | p | Deseasonalised r [95% CI] | p | Univariate OR [95% CI] | AUC |
|---|---|---|---|---|---|---|
| Air temperature (per 1 °C) | −0.05 (−0.17, 0.08) | 0.470 | −0.19 (−0.30, −0.07) | 0.002 | 0.97 (0.91, 1.04) | 0.551 |
| Relative humidity (per 10%) | 0.65 (0.57, 0.72) | < 0.001 | 0.28 (0.17, 0.38) | < 0.001 | 2.90 (2.42, 3.48) | 0.934 |
| Wind speed (per 1 m s−1) | −0.31 (−0.40, −0.21) | < 0.001 | −0.01 (−0.11, 0.09) | 0.900 | 0.36 (0.25, 0.51) | 0.729 |
**Note: rpb is the point-biserial correlation, and p values and intervals use the effective sample size. The deseasonalized coefficient correlates predictor anomalies with wet-day occurrence. OR = odds ratio from univariate logistic regression with Newey‒West (7-day) standard errors, AUC = area under the ROC curve.
The logistic models indicate this pattern, as presented in Table 5, as the seasonal timing (M1) discriminates wet from nonwet days (AUC = 0.910). However, adding same-day variables (M2) improved the fit significantly (likelihood ratio χ2 = 76.8, p < 0.001). Each 10-percentage-point increase in humidity multiplied the odds of a wet day by 5.5 (95% CI, 3.2–9.7), whereas temperature and wind speed were less significant. Moreover, previous-day humidity (OR = 3.6) and temperature (OR = 1.5) were significant in M3. The out-of-sample gain was small and negligible, whereas the AUC increased from 0.932 to 0.949 when a 2023-trained model was tested on 2024, only from 0.881 to 0.885 in the reverse direction, and M3 did not outperform M1 for 2023.
Table 5: Logistic regression models of wet-day occurrence (n = 730 days)
| Model | Predictors | AUC | AUC 2023→2024 | AUC 2024→2023 | AIC | LR χ2 vs M1 (p) | Odds ratio [95% CI] |
|---|---|---|---|---|---|---|---|
| M1 | Seasonal harmonics only | 0.910 | 0.932 | 0.881 | 421.1 | – | – |
| M2 | M1 + same-day T, RH, WS | 0.945 | 0.949 | 0.885 | 350.4 | 76.8 (< 0.001) | RH 5.55 (3.16, 9.74), T 1.29 (0.96, 1.73), WS 0.82 (0.53, 1.27) |
| M3 | M1 + previous-day T, RH, WS | 0.923 | 0.939 | 0.868 | 399.5 | 27.7 (< 0.001) | RH 3.59 (2.14, 6.02), T 1.46 (1.10, 1.95), WS 0.92 (0.61, 1.38) |
**Note: T = air temperature (per 1 °C), RH = relative humidity (per 10%), WS = wind speed (per 1 m s−1). Seasonal harmonics are two sine-cosine pairs of the day of the year. AUC 2023→2024 denotes a model fitted to 2023 and tested on 2024. The likelihood ratio (LR) tests have 3 degrees of freedom. Standard errors use the Newey‒West estimator (7-day lag); the first day is excluded, as M3 requires previous-day values.
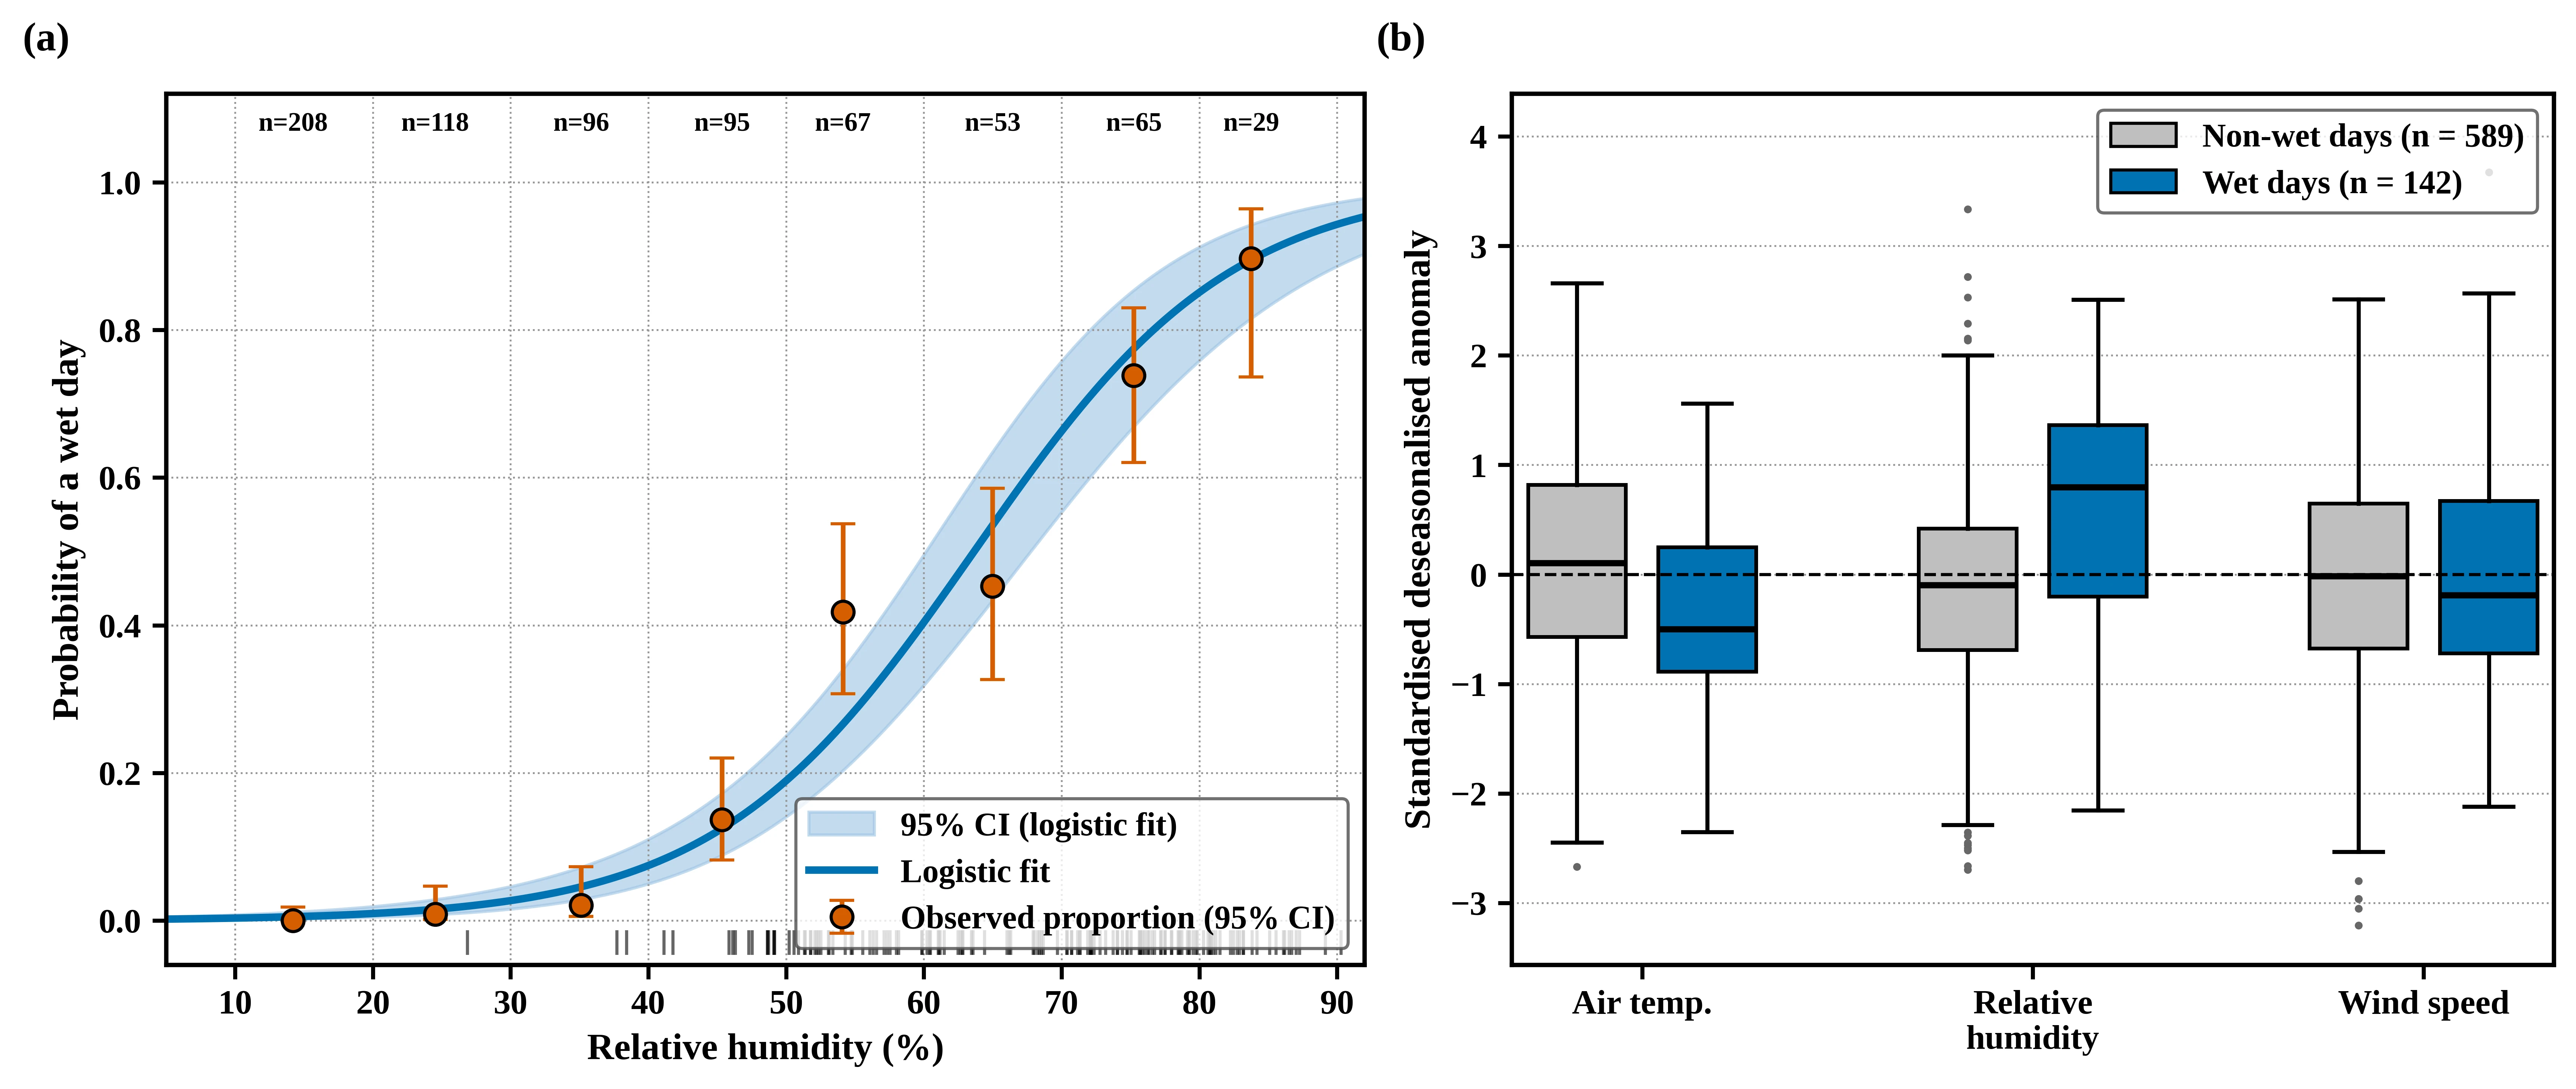
Fig. 5:(a) Proportion of wet days by relative humidity class (95% Wilson intervals, class sizes above) with the fitted logistic curve and 95% confidence band. (b) Standardized deseasonalized anomalies on nonwet and wet days.
Relative humidity therefore provides information on rainfall occurrence beyond the seasonal calendar, which is consistent with the importance of low-level moisture for Sahelian convection.[40] Although this does not establish that humidity controls storm formation, as same-day humidity is caused by rain and clouds and instability, convective inhibition and wind shear, which determine whether moist air develops into deep convection, were outside the scope of the data. Cooler anomalies on wet days are likewise more plausibly a consequence of rain than a precursor.[4] The negative wind–speed association is not evidence that calm conditions precede convection. It is not evident after deseasonalization and was absent from June–September (rpb = −0.02), indicating that it reflects stronger dry-season Harmattan winds, which coincide with the absence of rain. Moreover, daily winds averaged over a grid cell also smooth out the short-lived gust fronts and squall-line outflows that accompany Sahelian storms.[5,33]
5. Implications for seasonal risk communication
With respect to the timing of rainfall, approximately nine of the ten wet days fell between June and September, peaking in August, while seasonal preparedness in Maiduguri, such as reminders on drainage maintenance, flood readiness and lightning safety, would therefore be best issued before June and reinforced in July–August, alongside the predictions and warnings of NiMet.[41] However, lightning and public awareness were not observed in the data used, and the humidity results were not proposed as warning criteria.
6. Limitations and future research
The exploratory scope of this study points to clear directions for further research. The two-year record captures the seasonal cycle and one marked interannual contrast. Extending the analysis to the full NASA POWER record from 1981 onward would place 2023–2024 in a climatological context. Concurrent daily NiMet observations and upper-air indices, such as convective available potential energy, convective inhibition, lapse rates and vertical wind shear, were not available during this study. Comparing POWER with station records and adding ERA5 or MERRA-2 convective indices would strengthen data validation and the physical interpretation of the humidity association.[7,40]
7. Conclusion
In this study, two years of NASA POWER data were used to examine surface meteorological conditions associated with rainfall-defined wet days in Maiduguri. The rainfall was concentrated during the monsoon season; specifically, 94.8% of the rainfall and 89.4% of the wet days were supplied during June–September, with a peak in August, and the greater number of wet days in 2024 reflects the interannual variability. Relative humidity was the surface variable most closely associated with wet-day occurrence, and part of this association persisted after the seasonal cycle was removed. The negative association with wind speed was entirely seasonal, and temperature showed no consistent relationship, while surface variables added modest information beyond seasonal timing. Furthermore, by separating seasonal associations from within-season associations, this study provides a transparent local baseline for Maiduguri and a reproducible framework that can be extended with longer records, station data, convective indices and lightning observations. Future studies could incorporate satellite or ground-based lightning observations and radar to allow thunderstorm days to be distinguished from other rainy days.
Acknowledgments
The study data were obtained from the NASA Langley Research Center POWER Project funded through the NASA Earth Science Directorate Applied Science Program.
CRediT Author Contribution Statement
Emmanuel Yohanna: Conceptualization, Formal analysis, Writing – Review & editing. Gillian Musah Edward: Formal analysis, Writing – Review & editing. Bala Gabriel Abraham: Conceptualization, Formal analysis, Supervision, Writing – Review & editing. Umar Jidda Fatima: Formal analysis, Writing – Review & editing. Hauwa Mohammed: Formal analysis, Writing – Review & editing. All authors have read and approved the final version of the manuscript for publication and agree to be accountable for all aspects of the work, ensuring that questions related to the accuracy or integrity of any part of the work are appropriately investigated and resolved.
Funding Declaration
This research did not receive any specific grant from funding agencies in the public, commercial, or not-for-profit sectors.
Data Availability Statement
The daily data are freely available from NASA POWER (https://power.larc.nasa.gov) using the parameters and coordinates given in Section 3.1.
Competing Interests
There is no conflict of interest.
Artificial Intelligence (AI) Use Disclosure
The authors declare that artificial intelligence (AI)-assisted tools were used only for language refinement, grammar improvement, and manuscript structuring purposes during the preparation of this work. All technical content, experimental implementation, results, and interpretations were independently developed and verified by the authors.
Supporting Information
Not applicable.
References
- [1] A. H. Fink, D. G. Vincent, V. Ermert, Rainfall types in the West African Sudanian zone during the summer monsoon 2002, Monthly Weather Review, 2006, 134, 2143–2164, doi: 10.1175/MWR3182.1.
- [2] V. Mathon, H. Laurent, T. Lebel, Mesoscale convective system rainfall in the Sahel, Journal of Applied Meteorology, 2002, 41, 1081–1092, doi: 10.1175/1520-0450(2002)0412.0.CO;2.
- [3] R. I. Albrecht, S. J. Goodman, D. E. Buechler, R. J. Blakeslee, H. J. Christian, Where are the lightning hotspots on Earth?, Bulletin of the American Meteorological Society, 2016, 97, 2051–2068, doi: 10.1175/BAMS-D-14-00193.1.
- [4] C. M. Taylor, D. Belušić, F. Guichard, D. J. Parker, T. Vischel, O. Bock, P. P. Harris, S. Janicot, C. Klein, G. Panthou, The frequency of extreme Sahelian storms has tripled since 1982 according to satellite observations, Nature, 2017, 544, 475–478, doi: 10.1038/nature22069.
- [5] O. J. Matthew, M. A. Ayoola, Seasonality of wind speed, wind shears and precipitation over West Africa, Journal of Atmospheric and Solar-Terrestrial Physics, 2020, 207, 105371, doi: 10.1016/j.jastp.2020.105371.
- [6] D. Gueye, A. L. Dieng, K. M. Núñez Ocasio, Z. L. Moon, A. Deme, M. Sarr, S. Diouf, A. A. Coly, P. Fall, M. Thiam, Characterizing the morphology and thermodynamics of mesoscale convective systems driving extreme rainfall in West Africa, in West African Conference on Renewable Energies, Springer Nature Switzerland, 2025, 429–451, doi: 10.1007/978-3-032-17129-0_28.
- [7] C. A. Doswell III, Severe convective storms—An overview, in C. A. Doswell III (Ed.), Severe Convective Storms, 2001, 28,1–26, doi: 10.1175/0065-9401-28.50.1.
- [8] D. M. Romps, Ascending columns, WTG, and convective aggregation, Journal of the Atmospheric Sciences, 2021, 78, 497–508, doi: 10.1175/JAS-D-20-0041.1.
- [9] B. A. Choudhury, M. I. R. Tinmaker, Thermodynamic control of lightning activity in premonsoon and monsoon season over the Indian region, Journal of Atmospheric and Solar-Terrestrial Physics, 2025, 268, 106410, doi: 10.1016/j.jastp.2024.106410.
- [10] D. R. MacGorman, W. D. Rust, The Electrical Nature of Storms, Oxford University Press, 1998.
- [11] V. A. Rakov, M. A. Uman, Lightning: Physics and Effects, Cambridge University Press, 2003.
- [12] C. Saunders, Charge separation mechanisms in clouds, Space Science Reviews, 2008, 137, 335–353, doi: 10.1007/s11214-008-9345-0.
- [13] A. W. Ellis, B. Samson, Comparative assessment of POWER and CMAP satellite-derived rainfall products for hydroclimate monitoring in Nigeria, Theoretical and Applied Climatology, 2026, 157, 228, doi: 10.1007/s00704-026-06121-1.
- [14] J. F. Hermance, H. M. Sulieman, Adequacy of the daily TMPA 3B42 high-resolution satellite precipitation product for monitoring hydrometeorological hazards in the Southeast Sahel of Africa, International Journal of Remote Sensing, 2018, 39, 2579–2596, doi: 10.1080/01431161.2018.1430405.
- [15] E. K. Vizy, K. H. Cook, Extreme rainfall events in the West African Sahel: Understanding storm development over the Damergou gap using convection-permitting simulations in the Weather Research and Forecasting model, Quarterly Journal of the Royal Meteorological Society, 2023, 149, 959–983, doi: 10.1002/qj.4443.
- [16] S. Y. Dawa, M. L. Tan, N. Samat, R. Roy, F. Zhang, Evaluation of five gridded precipitation products for estimating precipitation and drought over Yobe, Nigeria, Water Supply, 2024, 24, 2039–2054, doi: 10.2166/ws.2024.113.
- [17] R. Gelaro, W. McCarty, M. J. Suárez, R. Todling, A. Molod, L. Takacs, C. A. Randles, A. Darmenov, M. G. Bosilovich, R. Reichle, K. Wargan, The Modern-Era Retrospective Analysis for Research and Applications, Version 2 (MERRA-2), Journal of Climate, 2017, 30, 5419–5454, doi: 10.1175/JCLI-D-16-0758.1.
- [18] J. C. Mikovitz, P. W. Stackhouse Jr., F. Patadia, B. Macpherson, N. Khadka, A Global Agroclimatology Solar Insolation and Meteorological Parameter Data Base: Meteorological Evaluation and Application Updates to NASA POWER, conference presentation, ASA, CSSA and SSSA International Annual Meeting, 2023.
- [19] A. Bichet, A. Diedhiou, West African Sahel has become wetter during the last 30 years, but dry spells are shorter and more frequent, Climate Research, 2018, 75, 155–162, doi: 10.3354/cr01515.
- [20] A. Maina, M. Grema, Application of an STL–ARIMA hybrid framework for monthly rainfall forecasting in Maiduguri, Nigeria, Journal of Science Research and Reviews, 2026, 3, 87–98, doi: 10.70882/josrar.2026.v3i1.146.
- [21] S. E. Nicholson, The West African Sahel: A review of recent studies on the rainfall regime and its interannual variability, International Scholarly Research Notices, 2013, 2013, 453521, doi: 10.1155/2013/453521.
- [22] T. O. Odekunle, F. A. Adesina, I. E. Gbode, A. O. Adeyefa, S. O. Ajadi, Variabilities and trends in the onset, peak, and retreat of Intertropical Discontinuity (ITD) annual migrations over West Africa between 1979 and 2020, Climate Dynamics, 2024, 62, 7149–7169, doi: 10.1007/s00382-024-07270-7.
- [23] B. F. Sasanya, S. O. Adesogan, A. A. Ademola, Spatiotemporal analysis of rainfall over Chad River Basin, Nigeria, Theoretical and Applied Climatology, 2025, 156, 118, doi: 10.1007/s00704-024-05338-2.
- [24] A. Tarhule, M. K. Woo, Changes in rainfall characteristics in northern Nigeria, International Journal of Climatology, 1998, 18, 1261–1271, doi: 10.1002/(SICI)1097-0088(199809)18:11<1261::AID-JOC302>3.0.CO;2-Z.
- [25] E. Yohanna, S. U. Abubakar, F. U. Jidda, Assessing the impacts of temperature and precipitation dynamics on climate variability across Northeast Nigeria, International Journal of Environment and Climate Change, 2025, 15, 121–136.
- [26] D. Cui, S. Liang, D. Wang, Observed and projected changes in global climate zones based on Köppen climate classification, WIREs Climate Change, 2021, 12, e701, doi: 10.1002/wcc.701.
- [27] M. I. Lélé, P. J. Lamb, Variability of the Intertropical Front (ITF) and rainfall over the West African Sudan–Sahel zone, Journal of Climate, 2010, 23, 3984–4004, doi: 10.1175/2010JCLI3277.1.
- [28] B. Sultan, S. Janicot, The West African monsoon dynamics. Part II: The “preonset” and “onset” of the summer monsoon, Journal of Climate, 2003, 16, 3407–3427, doi: 10.1175/1520-0442(2003)0162.0.CO;2.
- [29] A. H. Sparks, nasapower: A NASA POWER global meteorology, surface solar energy and climatology data client for R, Journal of Open Source Software, 2018, 3, 1035, doi: 10.21105/joss.01035.
- [30] R. H. Reichle, Q. Liu, R. D. Koster, C. S. Draper, S. P. P. Mahanama, G. S. Partyka, Land surface precipitation in MERRA-2, Journal of Climate, 2017, 30, 1643–1664, doi: 10.1175/JCLI-D-16-0570.1.
- [31] O. T. Faloye, V. Kamchoom, A. T. Ogunrinde, A. E. Ajayi, P. G. Oguntunde, N. Sinsamutpadung, Evaluation of various machine learning-based bias correction approaches for NASA POWER air temperatures: A case study of Nigeria, Big Earth Data, 2025, 9, 1111–1135, doi: 10.1080/20964471.2025.2565884.
- [32] X. Zhang, L. Alexander, G. C. Hegerl, P. Jones, A. Klein Tank, T. C. Peterson, B. Trewin, F. W. Zwiers, Indices for monitoring changes in extremes based on daily temperature and precipitation data, WIREs Climate Change, 2011, 2, 851–870, doi: 10.1002/wcc.147.
- [33] NASA POWER Project, Meteorological Data Assessment Process, NASA Langley Research Center, n.d., https://power.larc.nasa.gov/docs/methodology/meteorology/assessment/, Accessed 20 September 2026.
- [34] D. S. Wilks, Statistical Methods in the Atmospheric Sciences, 4th ed., Elsevier, 2019, doi: 10.1016/C2017-0-03921-6.
- [35] C. S. Bretherton, M. Widmann, V. P. Dymnikov, J. M. Wallace, I. Bladé, The effective number of spatial degrees of freedom of a time-varying field, Journal of Climate, 1999, 12, 1990–2009, doi: 10.1175/1520-0442(1999)0122.0.CO;2.
- [36] D. W. Hosmer Jr., S. Lemeshow, R. X. Sturdivant, Applied Logistic Regression, 3rd ed., Wiley, 2013, doi: 10.1002/9781118548387.
- [37] W. K. Newey, K. D. West, A simple, positive semidefinite, heteroskedasticity and autocorrelation consistent covariance matrix, Econometrica, 1987, 55, 703–708, doi: 10.2307/1913610.
- [38] M. V. K. Sivakumar, Agroclimatic Aspects of Rainfed Agriculture in the Sudano-Sahelian Zone, ICRISAT, 1989, http://oar.icrisat.org/id/eprint/4464, Accessed 15 September 2026.
- [39] A. H. Fink, A. Reiner, Spatiotemporal variability of the relation between African easterly waves and West African squall lines in 1998 and 1999, Journal of Geophysical Research: Atmospheres, 2003, 108, 4332, doi: 10.1029/2002JD002816.
- [40] D. J. Parker, M. Diop-Kane, Meteorology of Tropical West Africa: The Forecasters’ Handbook, Wiley, 2017, doi: 10.1002/9781118391297.
- [41] M. A. Cooper, C. J. Andrews, R. L. Holle, R. Blumenthal, N. Navarrete-Aldana, Lightning-related injuries and safety, in P. S. Auerbach (Ed.), Auerbach’s Wilderness Medicine, 2017, 7, 71–117.
Publisher Note
Publisher Note: The views, statements, and data in all publications solely belong to the authors and contributors. GR Scholastic is not responsible for any injury resulting from the ideas, methods, or products mentioned. GR Scholastic remains neutral regarding jurisdictional claims in published maps and institutional affiliations.
Open Access
This article is licensed under a Creative Commons Attribution-NonCommercial 4.0 International License, which permits the non-commercial use, sharing, adaptation, distribution and reproduction in any medium or format, as long as appropriate credit to the original author(s) and the source is given by providing a link to the Creative Commons License and changes need to be indicated if there are any. The images or other third-party material in this article are included in the article's Creative Commons License, unless indicated otherwise in a credit line to the material. If material is not included in the article's Creative Commons License and your intended use is not permitted by statutory regulation or exceeds the permitted use, you will need to obtain permission directly from the copyright holder. To view a copy of this License, visit: https://creativecommons.org/licenses/by-nc/4.0/
© The Author(s) 2026