

 Open Access||Research Article
Yield and Quality of Cabbage in Patuakhali and Barguna Districts of Bangladesh for Nutritional Security
Mohammad Ghani Miah, A.K.M. Faruk-E-Azam , Md. Nizam Uddin, Muhammad Maniruzzaman, Md Shariful Islam, Abdullah-Al-Zabir
Patuakhali Science and Technology University, Bangladesh
Abstract
Climate change is causing a gradual increase in soil salinity, which limits crop yield and quality. Human nutrition and food security are primarily dependent on vegetables. The research work was conducted to examine the impacts of soil salinity on yield and mineral accumulation of cabbage (Brassica oleracea var. capitata) grown in tidal areas of Dumki (electrical conductivity, EC = 0.82 dS m-1), Nauvanga (EC = 5.90 dSm-1), Pakhimara (EC = 6.82 dSm-1), Kumirmara (EC = 7.64 dSm-1) of Patuakhali and Sawdagarpara (EC = 9.31 dSm-1) of Barguna districts in Bangladesh during November 2024 to March 2025. The cabbage yields at Dumki, Nauvanga, Pakhimara, Kumirmara, and Sawdagarpara were 60.5, 58.0, 56.77, 55.0, and 52.0 t ha-1, respectively. The lowest yield was estimated at Sawdagarpara at the highest EC level. The edible portion was analyzed for phosphorus (P), potassium (K), calcium (Ca), magnesium (Mg), sulfur (S), sodium (Na), zinc (Zn), iron (Fe), copper (Cu), and manganese (Mn). Tissue analysis revealed that K concentration was highest at the non-saline baseline (Dumki) and trended lower across the saline locations. Conversely, P concentration did not follow a strict linear decline, peaking instead at the moderately saline site of Nauvanga (5.90 dS m⁻¹) before decreasing at higher EC levels. Meanwhile, Ca, Mg, S, Na, Fe, and Mn concentrations generally increased up to moderate soil salinity thresholds. Yield and mineral accumulations were reduced at the highest soil EC of 9.31 dsm-1. Therefore, cabbage can be grown in low-salinity areas within the study area to support nutritional security.
Keywords
Graphical Abstract
Novelty Statement
This study is among the first to evaluate the combined effects of natural coastal soil salinity gradients on cabbage yield and edible mineral composition in Bangladesh, demonstrating that moderate salinity alters nutrient accumulation patterns while high salinity significantly reduces both yield and nutritional quality.
1. Introduction
The total area of Bangladesh is 147,570 km2, with 29,000 km2 of coastal area. But over 30% of cultivated areas are coastal and offshore.[1] Approximately 50% of coastal lands are subject to various levels of inundation, and as a consequence, their use is limited. This situation is likely to worsen in the future due to the impacts of climate change.[2] In this area, salinity intrusion is primarily sourced from climate change and anthropogenic changes that render the area more vulnerable. Therefore, the salinity intrusion negatively impacts water, soil, agriculture, fisheries, ecosystem, and livelihoods in this region.[3] High salt ion concentrations also cause damage to the photosynthetically active leaves and can cause chlorosis and senescence of the leaves.[4] Due to climate change and associated catastrophic events such as sea-level rise, super cyclone Sidr (recent past), cyclone Aila, and storm surge, salinity has further increased many-fold.[5] The increase in salinity of water and soil due to saltwater intrusion at the coasts could be causing some negative impacts on agriculture, forestry, and fisheries.[6] Salinization is a major problem in Bangladesh, especially in coastal areas, where climate change is causing more and more extreme cyclones, causing farmers’ fields to flood. Residents living in these areas are typically dependent on agriculture, and their lives are now endangered. The natural salinity is the accumulation of salts that has taken place over a period of time.[7] Soils having electrical conductivity (EC1:5) exceeding 2.1 dSm−1 at 25 °C are identified as saline soils, which corresponds to a saturated paste extract (ECe) threshold exceeding 4.0 dSm⁻¹ based on the official empirical conversion factor (ECe=EC1.5*5.8) established for coastal soils of Bangladesh by the Soil Resource Development Institute (SRDI).[8] This conversion factor addresses the non-interchangeability of extraction methods and provides a standardized baseline for crop-tolerance classifications. Salt stress hampers germination, speed of germination, root/shoot dry weight, and Na+, K+ ratio in root and shoot.[9]
Vegetables provide health benefits, being low in fat and calories but rich in vitamins, protein, and fiber. They
are also an important source of minerals like phosphorus, potassium, calcium, magnesium, iron, copper, manganese, selenium, and zinc.[10] They contain essential amino acids and antioxidants that the human body needs to function normally. Vegetables are considered one of the most important food crops because of their high nutritional value, higher yield, and higher return.[11] Almost all vegetables used worldwide are free of cholesterol. Vegetables, if eaten fresh or partially cooked, can help counter cancer, diabetes, high blood pressure, vision loss, heart disease, and a number of intestinal disorders. Vegetable cultivation helps to employment generation, increase income, and reduce poverty in developing countries like Bangladesh.[12] Vegetable crops are especially important for farmers with small holdings because of higher income per hectare than conventional staple crops.[13] Cabbage is one of the most important, highly nutritious, and palatable leafy winter vegetables widely cultivated in Bangladesh. It is a rich source of protein, minerals, and vitamin A. Cabbage can prevent constipation, increase appetite, speed up digestion, and is very useful for diabetic patients.[14] Cabbage (Brassica oleracea L. var. capitata) is an important and nutritious leafy winter vegetable. It is among the top 20 vegetables and an important global food source.[15] Nutritionally, it contains vitamins A, B, C, E, and iron, potassium, zinc, etc. It is widely distributed in Bangladesh, including Chandpur, Comilla, Gazipur, Mymensingh, and Jessore.[16] For vital nutritional security, income for coastal farmers, and for productive use of winter season fallow lands, the present study was conducted to examine the yield and minerals accumulation performance of cabbage at different soil salinity in the southern coastal region of Bangladesh
2. Materials and methods
Vegetables were grown, harvested, and collected from November 2024 to March 2025 across five areas in the Patuakhali and Barguna districts. Among the five selected locations, one was saline-free (Dumki), while the other four (Nauvanga, Pakhimara, Kumirmar, and Sawdagarpara) were classified as slightly to moderately saline. These site classifications were established by measuring laboratory (EC1.5) and converting them to standard (ECe) values using the SRDI regional conversion factor (ECe=EC1.5*5.8) to guarantee accurate cross-referencing with standard FAO crop-salinity tolerance classes. As cabbage has demand in this region, and to evaluate the feasibility of cabbage cultivation and its yield and mineral content variation across different saline and non-saline soils, four locations with varying degrees of salinity and one salinity-free location were selected. A randomized complete block design (RCBD) was used in the experiment, wherein each of the five geographic locations contained three independent, physically separated field plots serving as three distinct replications (n=3) plots per location).
The Fertilizers applied for soil preparation were as follows: cow dung 50 tons, urea 25 kg, TSP 125 kg, MOP 200 kg, and ZnSO4 8 kg per hectare. The dose and application of fertilizers were maintained as directed by BARC (2018).[17] The variety of cabbage used was Atlas-70 (Green cabbage); seedlings were raised in a 1 m × 5 m seedbed. 30-day-old seedlings were transplanted at a spacing of 50 cm × 50 cm on 3 November, 2024. Non-saline pond water nearest to the respective locations was used for irrigation. Watering was done twice a week up to maturity. Crop management practices such as weeding and mulching. Soil furrowing and other necessary management practices were carried out as required. For the management of pests, integrated pest management (IPM) was practiced. After maturity, when the heads attained a compact form, then the crop was suitable for harvesting. To capture the full production span, vegetables were collected 3 times at 10-day intervals from each plot. To maintain true biological replication for subsequent statistical analyses, temporal sub-samples from the same field plot were composited together. This intra-plot pooling protocol preserved the 3 independent field plot replications for each of the 5 locations, yielding a final set of 15 independent composite samples for laboratory analysis. Harvesting of edible portions of Cabbage was done by cutting the plant a few cm above the ground with a sharp knife. First harvesting was done 90 DAT. The yield of 1 m2 area within each replicate plot was multiplied by 10000 to obtain the yield per hectare. Soil from different locations in each vegetable field was collected at a depth of 0-15 cm using an auger, and composite samples were prepared. The samples were brought to the laboratory, processed, and reserved accordingly.
2.1 Sampling sites and crop management practices
Vegetables were grown, harvested, and collected from November 2024 to March 2025 across five areas in the Patuakhali and Barguna districts. Among the five selected locations, one was saline-free (Dumki), while the other four (Nauvanga, Pakhimara, Kumirmar, and Sawdagarpara) were classified as slightly to moderately saline. These site classifications were established by measuring laboratory (EC1.5) and converting them to standard (ECe) values using the SRDI regional conversion factor (ECe=EC1.5*5.8) to guarantee accurate cross-referencing with standard FAO crop-salinity tolerance classes. As cabbage has demand in this region, and to evaluate the feasibility of cabbage cultivation and its yield and mineral content variation across different saline and non-saline soils, four locations with varying degrees of salinity and one salinity-free location were selected. A randomized complete block design (RCBD) was used in the experiment, wherein each of the five geographic locations contained three independent, physically separated field plots serving as three distinct replications (n=3) plots per location).
The Fertilizers applied for soil preparation were as follows: cow dung 50 tons, urea 25 kg, TSP 125 kg, MOP 200 kg, and ZnSO4 8 kg per hectare. The dose and application of fertilizers were maintained as directed by BARC (2018).[17] The variety of cabbage used was Atlas-70 (Green cabbage); seedlings were raised in a 1 m × 5 m seedbed. 30-day-old seedlings were transplanted at a spacing of 50 cm × 50 cm on 3 November, 2024. Non-saline pond water nearest to the respective locations was used for irrigation. Watering was done twice a week up to maturity. Crop management practices such as weeding and mulching. Soil furrowing and other necessary management practices were carried out as required. For the management of pests, integrated pest management (IPM) was practiced. After maturity, when the heads attained a compact form, then the crop was suitable for harvesting. To capture the full production span, vegetables were collected 3 times at 10-day intervals from each plot. To maintain true biological replication for subsequent statistical analyses, temporal sub-samples from the same field plot were composited together. This intra-plot pooling protocol preserved the 3 independent field plot replications for each of the 5 locations, yielding a final set of 15 independent composite samples for laboratory analysis. Harvesting of edible portions of Cabbage was done by cutting the plant a few cm above the ground with a sharp knife. First harvesting was done 90 DAT. The yield of 1 m2 area within each replicate plot was multiplied by 10000 to obtain the yield per hectare. Soil from different locations in each vegetable field was collected at a depth of 0-15 cm using an auger, and composite samples were prepared. The samples were brought to the laboratory, processed, and reserved accordingly.
2.2 Analytical methods for soil and vegetable samples
Soil pH, EC, vegetable minerals and heavy metal determination were done following the standard methods (Table 1).
| Parameter | Extraction method/ Reagent | Extraction method/ Reagent | Instrument | Reference |
|---|---|---|---|---|
| Parameter | Vegetable | Soil | ||
| pH | - | 1:2.5 (Soil: Distilled water) | pH meter | [18] |
| EC (dSm-1) | - | 1:5 (Soil: Distilled water) | EC meter | [19] |
| OM (%) | - | As directed by Walkley and Black | - | [20] |
| N (%) | - | Kjeldahl method | Kheldahl apparatus | [21] |
| P (mg kg-1) | Di-acid mixture (HNO3:HCIO4=2:1) | 0.5M NaHCO3 solution (pH 8.5) | Spectrophotometer | [18,22] |
| K and Na (mg kg-1) | Di-acid mixture (HNO3:HCIO4=2:1) | 1N NH4OAc (pH 7.0) | Flame emission spectrophotometer | [23] |
| Ca and Mg (mg kg-1) | Di-acid mixture (HNO3:HCIO4=2:1) | 1N NH4OAc (pH 7.0) | Complexometric titration | [24] |
| S (mg kg-1) | Di-acid mixture (HNO3:HCIO4=2:1) | CaCl2 (0.15%) | Spectrophotometer | [25] |
| B (mg kg-1) | - | Azomethine-H method | Spectrophotometer | [26] |
| Zn, Cu, Fe, Mn (mg kg-1) | Di-acid mixture (HNO3:HCIO4=2:1) | DTPA Extraction (for soil Zn) | Atomic Absorption Spectrophotometer (AAS) | [27,28] |
| Parameter | Extraction method/ Reagent | Extraction method/ Reagent | Instrument | Reference |
|---|---|---|---|---|
| Parameter | Vegetable | Soil | ||
| pH | - | 1:2.5 (Soil: Distilled water) | pH meter | [18] |
| EC (dSm-1) | - | 1:5 (Soil: Distilled water) | EC meter | [19] |
| OM (%) | - | As directed by Walkley and Black | - | [20] |
| N (%) | - | Kjeldahl method | Kheldahl apparatus | [21] |
| P (mg kg-1) | Di-acid mixture (HNO3:HCIO4=2:1) | 0.5M NaHCO3 solution (pH 8.5) | Spectrophotometer | [18,22] |
| K and Na (mg kg-1) | Di-acid mixture (HNO3:HCIO4=2:1) | 1N NH4OAc (pH 7.0) | Flame emission spectrophotometer | [23] |
| Ca and Mg (mg kg-1) | Di-acid mixture (HNO3:HCIO4=2:1) | 1N NH4OAc (pH 7.0) | Complexometric titration | [24] |
| S (mg kg-1) | Di-acid mixture (HNO3:HCIO4=2:1) | CaCl2 (0.15%) | Spectrophotometer | [25] |
| B (mg kg-1) | - | Azomethine-H method | Spectrophotometer | [26] |
| Zn, Cu, Fe, Mn (mg kg-1) | Di-acid mixture (HNO3:HCIO4=2:1) | DTPA Extraction (for soil Zn) | Atomic Absorption Spectrophotometer (AAS) | [27,28] |
*Note: EC = electrical conductivity, OM = Organic matter
2.3 Statistical analysis
Data from the 15 independent composite samples (5 locations × 3 true replicate plots) were subjected to statistical validation. Significant mean differences among the sampling locations were calculated by performing Analysis of Variance (ANOVA) based on the RCBD design and Tukey HSD Post-Hoc test. Moreover, the data were subjected to Principal Component Analysis (PCA) for assessing the contribution of principal components to the total variability of the dataset and Pearson correlation analysis for identifying the associations among the variables using the statistical software R.
3.1 Soil pH and EC values
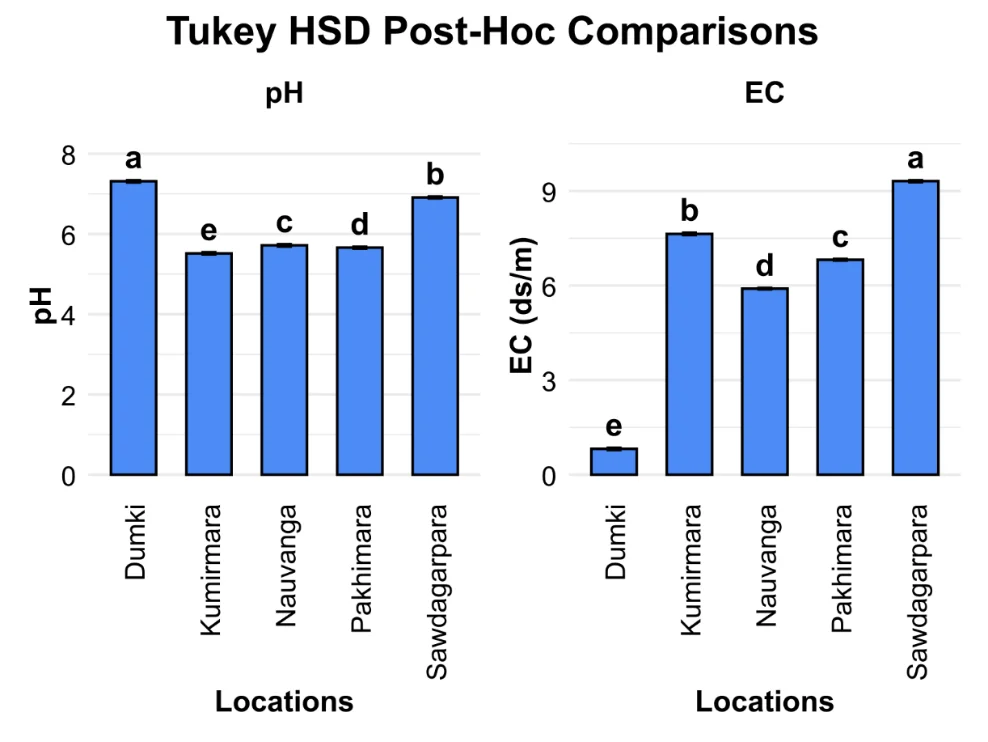
The average EC level of soil in Dumki, Nauvanga, Pakhimara, Kumirmara, and Sawdagarpara was 0.82, 5.90, 6.82, 7.64, and 9.31 dSm-1, respectively. The raising of EC level happened because of salinity. The closer we get to the coastal area, the higher the soil salinity (Fig. 1). This finding is in line with previous research that has reported higher soil salinity levels in coastal areas.[29] The mean EC value of all the soil samples was significantly different (p < 0.001).
The average soil pH of the study area was 7.31, 5.72, 5.66, 5.52, and 6.91 in Dumki, Nauvanga, Pakhimara, Kumirmara, and Sawdagarpara, respectively (Fig. 1). The negative relationship between soil pH and EC levels in the form of a power function, rather than a linear relationship, is due to the complex interplay of various factors such as soil minerals, porosity, texture, moisture, and temperature.[30] The mean pH of all the soil samples from different locations varied significantly. Except for the difference (p < 0.01) between Nauvanga and Pakhimara, all other differences were significant at 1% level of confidence (p < 0.001). The observed high EC levels and low pH values in some study areas could negatively impact soil quality and agricultural productivity. Salinity can affect plant growth and yield by reducing water uptake and increasing toxic ion concentrations in the soil. Excessive accumulation of sodium in cell walls can rapidly lead to osmotic stress and cell death.[31] Similarly, soil acidity can limit the availability of essential nutrients for plant growth and can also
result in the leaching of aluminum and other toxic elements.[32]
3.2 Elemental concentration of soil samples
As shown in Table 2, soil organic matter and ionic constituents varied across the five sampling locations in the Patuakhali and Barguna districts. Because electrical conductivity (EC) co-varies with these site-specific soil properties, geographic location acts as a confounding factor. Consequently, variations in plant parameters are interpreted as being associated with the cumulative soil environment across the EC gradient, rather than being attributed solely to an isolated salinity effect.
The concentration of different elements in the soil sample is shown in Table 2. Organic matter (OM) was in low to medium range at all the sites, ranging from 1.46% (Sawdagarpara) to 2.10% (Dumki) and generally declining from Dumki to Sawdagarpara. This indicates moderate depletion of the soil generally encountered in coastal soils under intensive cultivation. N had a similar trend to OM (0.07–0.11%) and it was very low to low at all stations. Highest amount of N was found in the soil of Dumki and the lowest was in Sawdagarpara. Phosphorus varied between sites from 12.93 to 27.86 mg kg-1. Dumki had the highest amount, with twice the phosphorus found in Sawdagarpara, which had the lowest. The trend is similar to that observed at lower salinity and near-neutral pH in Dumki, where the same conditions are expected to favor better phosphorus retention and availability in the soil. Potassium ranged from 149.0 to 210.6 mg kg-1, with the highest concentration in Kumirmara (210.6 mg kg-1), followed closely by Dumki (198.9 mg kg-1), which does not show the same trend as seen for phosphorus. Sawdagarpara once again recorded the lowest potassium value at 149.0 mg kg-1, followed by comparatively lower values for the primary macronutrients at this site. Calcium was, in fact, by far the most abundant of the five nutrients measured, with levels ranging from 1214.0 to 1999.5 mg kg-1, many times higher than those of the other nutrients. In contrast to pH and salinity, Dumki, with the healthiest pH and lowest salinity, actually had the lowest calcium content (1214.0 mg kg-1). The highest calcium concentration was observed in Kumirmara (1999.5 mg kg-1). This means that at the more saline sites, the soils are gaining calcium, likely from the same saline water sources, while the less saline soils are losing salinity. The pattern for magnesium was remarkably similar to that of calcium. The range of concentrations was 388.0-573.6 mg kg-1, with Nauvanga (452.4 mg kg-1), Pakhimara (499.0 mg kg-1), and Sawdagarpara (522.0 mg kg-1) in between. Again, the lowest salinity site (Dumki) had lower levels of magnesium, and the higher salinity sites had increasing magnesium levels - reinforcing the notion that there is a strong relationship between saline intrusion in this coastal region and increased concentrations of secondary nutrients. The sulfur concentrations ranged from 65.01 to 102.33 mg kg-1 and followed the same trend as salinity, increasing with salinity across the sites. The lowest (65.01 mg kg-1) and highest (102.33 mg kg-1) values of sulfur contents were observed in Dumki and Sawdagarpara, respectively. The trend of increase in sulfur content observed from Dumki to Nauvanga, Pakhimara, Kumirmara, and Sawdagarpara was similar to that of EC, Ca, and Mg. Zinc was greater than 0.6 mg kg-1 the critical deficiency level, from 0.80 mg kg-1 (Dumki) to 1.10 mg kg-1 (Kumirmara) indicating adequate availability of Zn in the study sites.[33] Boron level ranged from 0.38 mg kg⁻¹ (Nauvanga) to 0.47 mg kg⁻¹ (Pakhimara) which is above the critical level of 0.20 mg kg⁻¹.[33] This shows that Zn and B fertilization was not urgent for crop cultivation during the study period.
| SL No. | Locations | pH | EC (dSm⁻¹) | OM (%) | N (%) | P | K | Ca | Mg | S | Zn | B |
|---|---|---|---|---|---|---|---|---|---|---|---|---|
| mg kg-1 | mg kg-1 | mg kg-1 | mg kg-1 | mg kg-1 | mg kg-1 | mg kg-1 | ||||||
| 01 | Dumki | 7.31 | 0.82 | 2.1 | 0.11 | 27.86 | 198.9 | 1214.0 | 388.0 | 65.01 | 0.8 | 0.4 |
| 02 | Nauvanga | 5.72 | 5.90 | 1.75 | 0.09 | 18.32 | 171.6 | 1624.0 | 452.4 | 68.92 | 0.97 | 0.38 |
| 03 | Pakhimara | 5.66 | 6.82 | 1.68 | 0.08 | 16.45 | 174.1 | 1856.0 | 499.0 | 71.84 | 0.9 | 0.47 |
| 04 | Kumirmara | 5.52 | 7.64 | 1.52 | 0.08 | 14.76 | 210.6 | 1999.5 | 573.6 | 80.98 | 1.1 | 0.39 |
| 05 | Sawdagarpara | 6.91 | 9.31 | 1.46 | 0.07 | 12.93 | 149.0 | 1740.0 | 522.0 | 102.33 | 0.88 | 0.41 |
| Range | 5.52-7.31 | 0.82-9.31 | 1.46-2.1 | 0.07-0.11 | 12.93-27.86 | 149.0-210.6 | 1214.0-1999.5 | 452.4-573.6 | 65.01-102.33 | 0.8-1.1 | 0.38-0.47 |
3.3 Yield of cabbage
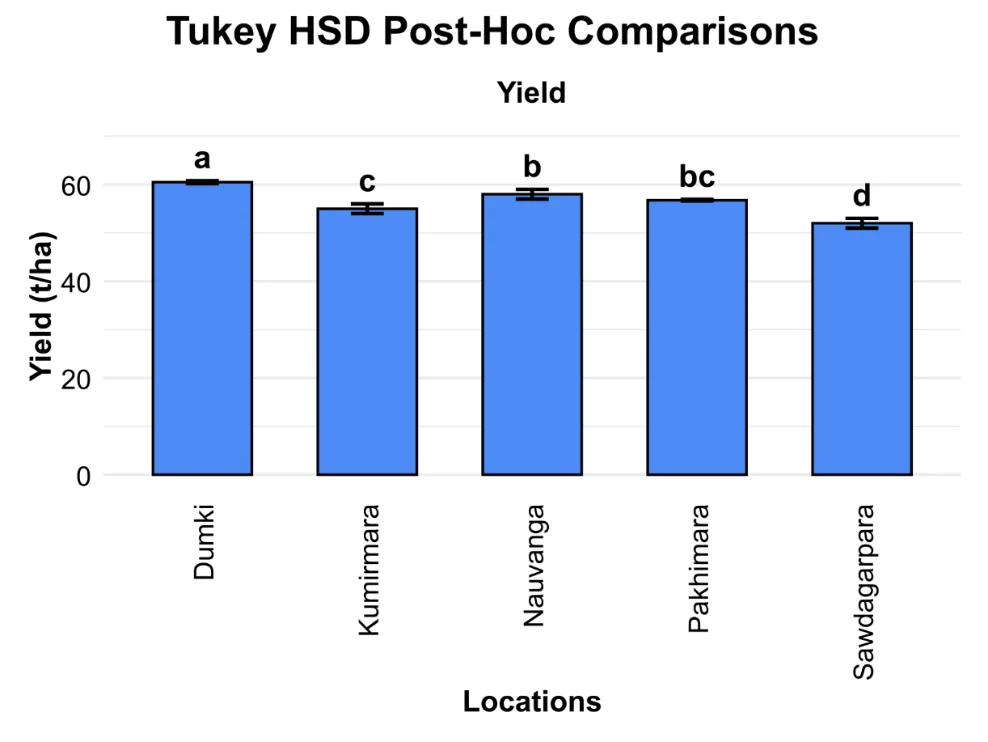
The average yield of cabbage in Dumki, Nauvanga, Pakhimara, Kumirmara, and Sawdagarpara was 60.5, 58.0, 56.77, 55.0, and 52.0 t ha-1, respectively. The yield was obtained higher from Dumki to Sawdagarpara because of high organic matter, and other nutrients (Table 2) (Fig. 2). Similarly, a remarkable decrease in the yield from 26.9 to 9.6 t ha−1 and from 15.8 to 4.9 t ha−1 in cauliflower and broccoli, respectively occurred as the electrical conductivity of the saturated-soil extract (ECe) increased from 2.0 dS m−1 (NSC) to 6.0 dS m−1 (S4) in research conducted by Pascale et al., 2005.[34] A significant mean difference in cabbage yield was observed across all locations except Nauvanga and Pakhimara. As the study was conducted in single season and limited locations, the result obtained here might be changed due to variation of locations and seasons.
Fig 2: Yield of cabbage at different locations in Patuakhali and Barguna districts.
3.4 Phosphorus and potassium concentration in cabbage
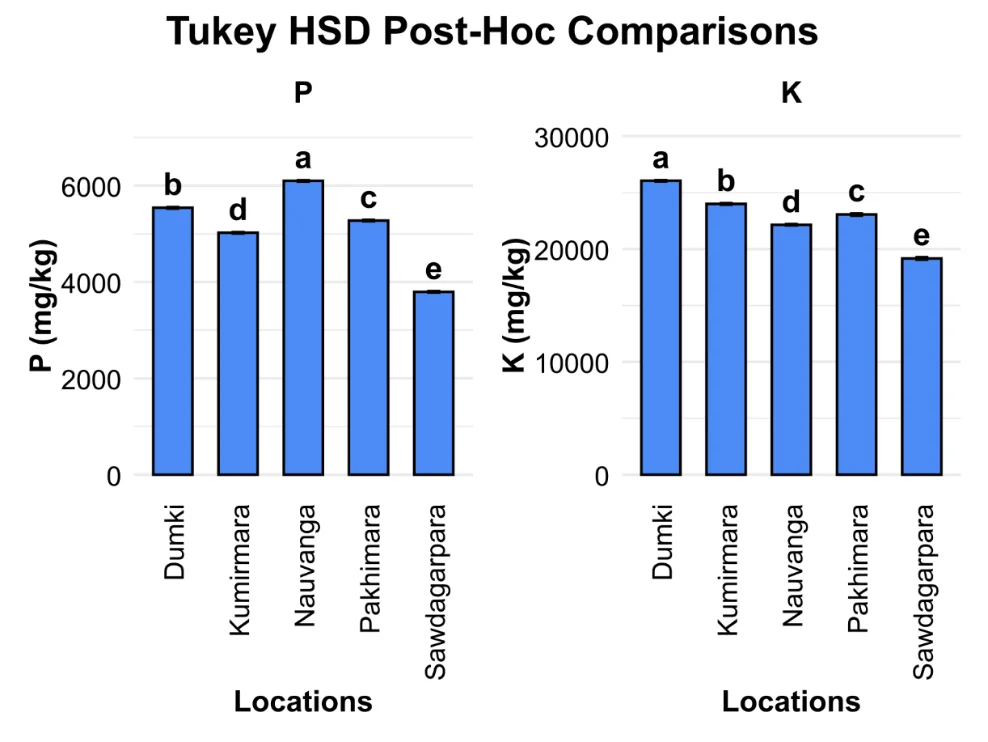
Phosphorus and Potassium concentration in cabbage in Dumki, Nauvanga, Pakhimara, Kumirmara, and Sawdagarpara were 5540.4, 6399, 5275.2, 5022, 3795.67, and 26052.3, 22151, 23062.7, 24000.7, 19166.7 mg kg-1, respectively. Phosphorus concentration was highest in Nauvanga at EC level 5.90 dSm-1, and Potassium concentration was highest in Dumki at EC level 0.82 dSm-1 (Fig. 3). Adhikari et al. (2023) treated romaine lettuce with different doses of NaCl solutions and observed almost similar results to this experiment.[35] Tukey’s post hoc comparisons showed a significant difference (p < 0.001) for P among all the locations. Homeostasis of macro and micro-elements, particularly in white cabbage and kale, was not disturbed significantly at low to moderate salinity, while the K level did not decrease significantly, and Ca was even increased in white cabbage. Salinity may elicit phytochemical accumulation in selected vegetables grown on saline soils without undesirable disruption of macro- and microelement homeostasis, depending on salt concentration and variety.[36] Mean K also exhibited significant variations (p < 0.001) among the sampling locations, like P.
3.5 Calcium and Magnesium concentration in cabbage
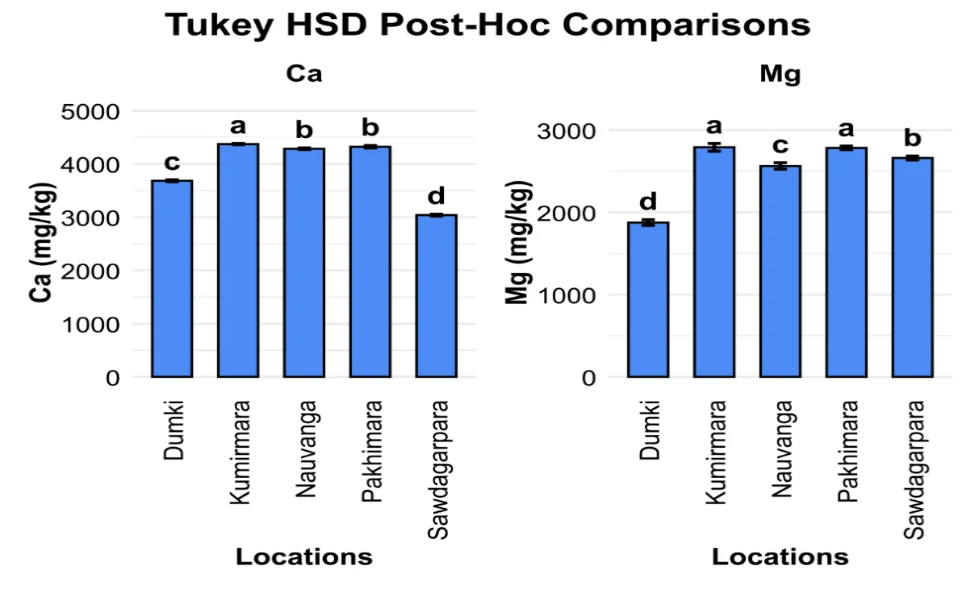
Calcium and Magnesium concentration in cabbage in Dumki, Nauvanga, Pakhimara, Kumirmara, and Sawdagarpara were 3682.33, 4283, 4321.67, 4371.67, 3038.33, and 1876, 2563.33, 2783.67, 2791, 2660.67 mg kg-1, respectively. Calcium and Magnesium concentration were highest in Kumirmara at EC level 7.64 dSm-1 because of high OM content (Fig. 4). Faruk-E-Azam et al. (2018) reported that lower Ca and Mg were found in most vegetables collected from saline areas of southern Bangladesh and they also stated that a high EC does not always reduce tissue Ca or Mg if the saline soil is also rich in high concentrations of those nutrients.[37] This supports the findings of this study. The mean Ca of Pakhimara and Kumirmara differed at the 5% confidence level, with a p-value of 0.039. But Nauvanga and Pakhimar did not show any significant difference for Ca. All other mean differences were significant at 1% level. The mean Mg content of Sawdagarpara varied significantly with both Pakhimara and Kumirmara at the 1% level (p < 0.01), and with Nauvanga at the 5% level (p < 0.05). All other differences were significant at the 0.01% confidence level (p < 0.001). Under salinity stress, major elements Ca, K, and Mg were not significantly affected in the more salt-tolerant kale and white cabbage, and only significantly reduced by salinity in Chinese cabbage, a more sensitive cultivar.[38] The nutrient content of microelements varied among species.
3.6 Sulfur and Sodium concentration in cabbage
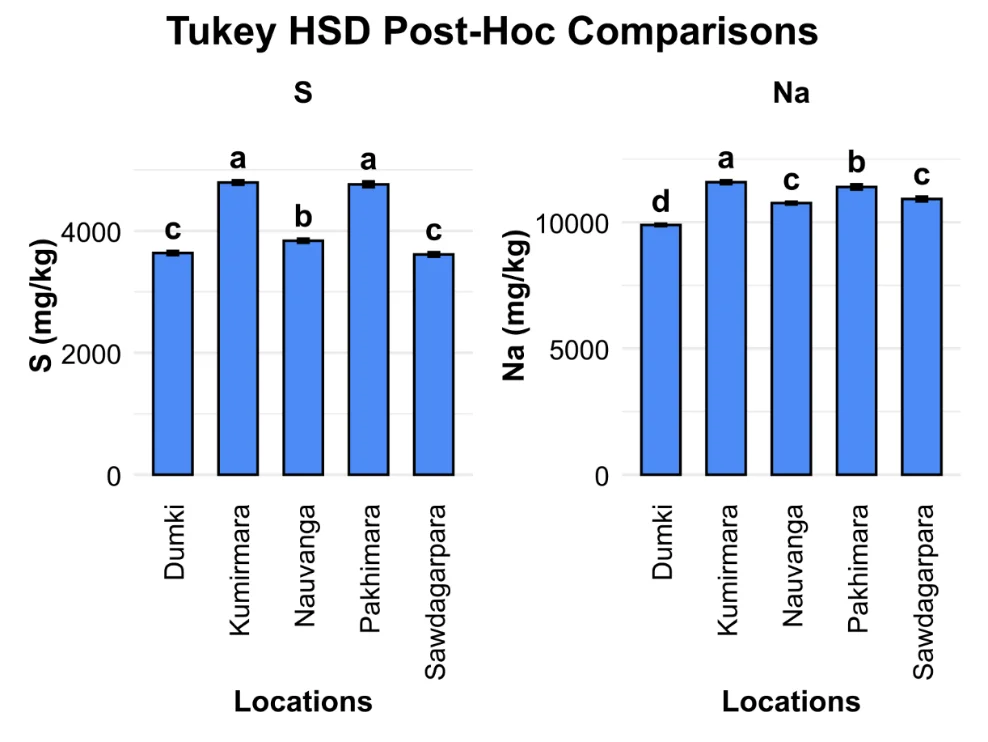
Sulfur and Sodium concentrations in cabbage in Dumki, Nauvanga, Pakhimara, Kumirmara, and Sawdagarpara were 3636.67, 3838, 4763.33, 4794, 3612.33, and 9890.7, 10758, 11396.3, 11587, 10918.7 mg kg-1, respectively. Sulfur and Sodium concentrations were highest in Kumirmara at EC level 7.64 dSm-1 because of high OM content (Fig. 5). As per Ferreira et al. (2020), Na content in ‘Raccoon’, shoot increased approximately 2.1-fold at low K and 5.2-fold at adequate K content when two spinach cultivars (‘Raccoon’ and ‘Gazelle’) were treated with 5–120 mM NaCl solutions.[39] On the other hand, sulfur was found to decrease by about 31% in ‘Raccoon’ and 16–21% in ‘Gazelle’ as salinity increased. Sulfate-rich salinity can increase plant S content, whereas NaCl salinity may reduce S concentration through dilution, impaired sulfate uptake, or nutrient imbalance.[39] All the mean differences for S were significant (p < 0.001), except for the insignificant differences between Dumki – Sawdagarpara and Pakhimara – Kumirmara. On the other hand, the mean Na content in cabbage varied significantly for most of the sampling locations. Mean value did not differ only between Nauvanga and Sawdagarpara.
3.7 Zinc and iron concentration in cabbage
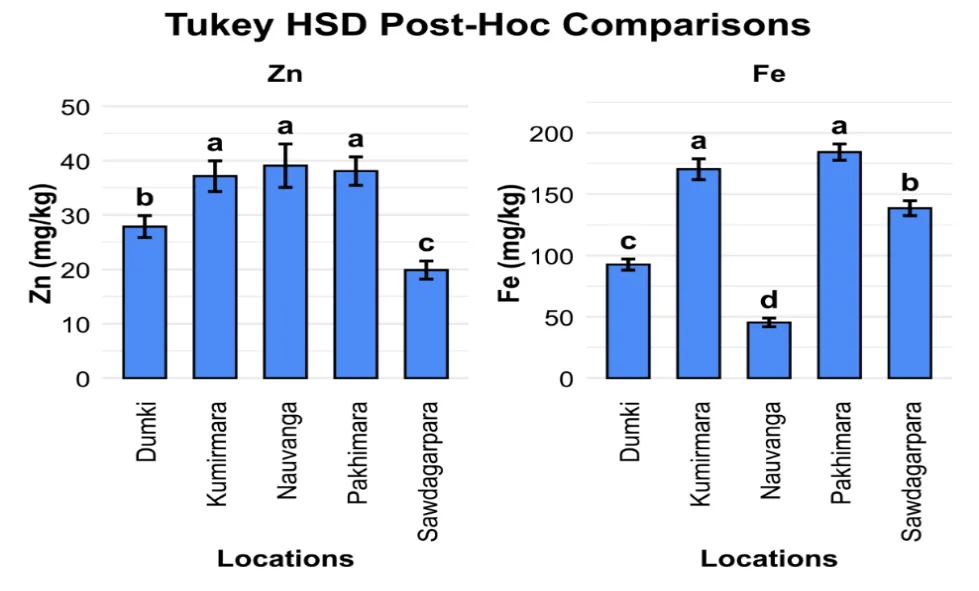
Zinc and iron concentrations in cabbage in Dumki, Nauvanga, Pakhimara, Kumirmara, and Sawdagarpara were
27.87, 39.07, 38.07, 37.13, 19.9, and 92.6, 45.4, 184.33, 170.33, 138.53 mg kg-1, respectively. Zinc concentration was highest in Nauvanga at EC level 5.90 dSm-1, and Iron concentration was highest in Pakhimara at EC level 6.83 dSm-1 (Fig. 6). Unlike macronutrients, micronutrients did not show many differences among the sampling locations. Kumirmara, Nauvanga, and Pakhimara did not show any significant differences in Zn. Sawdagarpara and Dumki differed significantly from all other locations. In the case of Fe, only one mean difference between Pakhimara and Kumirmara was insignificant. All other differences varied significantly (p < 0.001). Micronutrient and sodium contents in cabbage shoots reduced with the increase in NaCl concentration, while increasing the Fe2+ content by 46.5%, that of Zn2+ by 19.9%, that of Mn2+ by 37.7%, and that of Na by 40.8%. It was observed that increasing the SO42−dose. Similarly, increasing SO42− increased the contents of Cu2+, Mn2+, and Na+ in the shoot by 79.7, 9.5, and 33.8%, respectively.[40]
3.8 Copper and Manganese concentration in cabbage
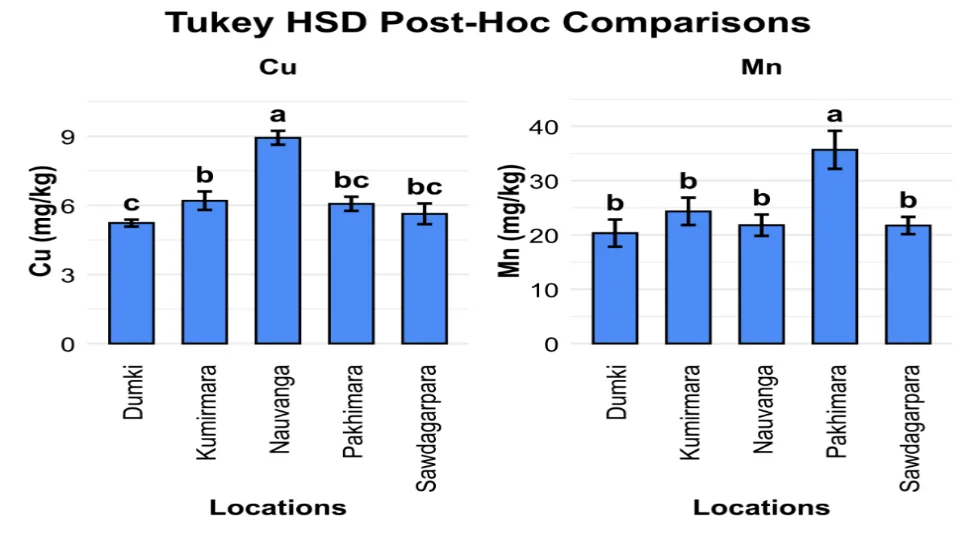
Copper and Manganese concentration in cabbage in Dumki, Nauvanga, Pakhimara, Kumirmara, and Sawdagarpara were 5.23, 8.93, 6.07, 6.2, 5.6, and 20.3, 21.8, 35.7, 24.33, 21.73 mg kg-1, respectively. Copper concentration was highest in Nauvanga at an EC of 5.90 dSm-1, and Manganese concentration was highest in Pakhimara at an EC of 6.83 dSm-1 (Fig. 7). In the case of Cu, Nauvanga showed a notable and significant difference from all other sampling locations. Besides, Dumki showed a significant difference (p < 0.05) from Kumirmara. All other differences were statistically insignificant. Mean content of Mn did not show much significant variation across the sampling sites. Only the mean value for Pakhimara differed significantly from those of the other locations. T. ciliata was highly affected by salinity for its mineral, proximate, antinutrient, and phytochemical composition. The flower buds and leaves treated with control and 50 mM contained significantly higher amounts of macro and micronutrients compared to the other treatments, with the exception of the heavy metals (Zn and Cu), which increased with rising salinity, and were considerably greater in the roots. Higher moisture and N content were found at low salinity, while higher ash content in leaves was recorded under high salinity. [41]
3.9 Principal component analysis (PCA)
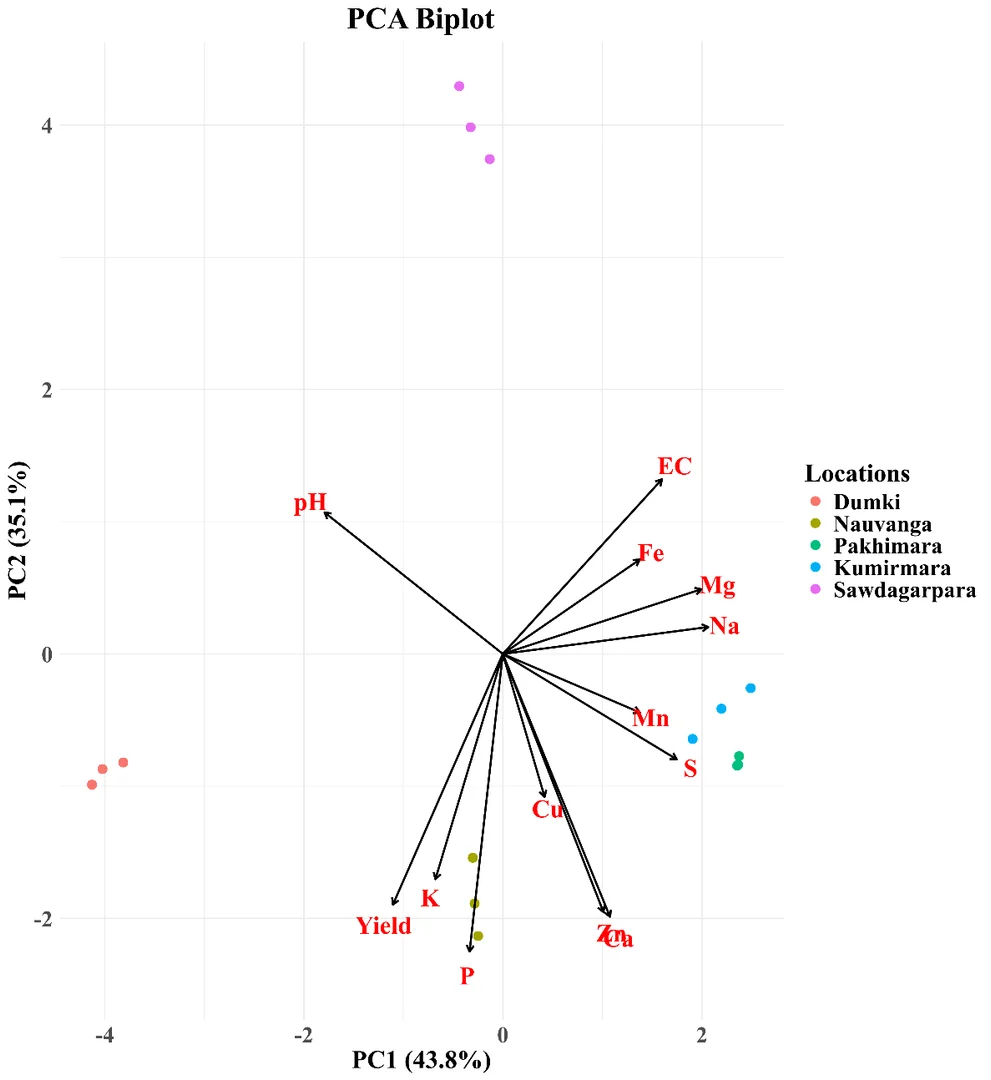
Results of principal component analysis are shown in Fig. 8. PCA was conducted using individual replicate observations. The first principal component accounts for 43.8% of the dataset's variability, and the second principal component accounts for 35.1%. Almost all the data points formed distinct clusters, except for Pakhimara and Kumirmara, which were in the same cluster, indicating they are similar to each other. Among the variables, EC, Mg, Na, Zn, and Ca had a strong positive contribution to PC1, and on the other hand, pH, EC, Fe, Mn, and Na exerted a strong positive contribution to PC2 (Table 3). Correlations among EC, Fe, Mg, and Na; Mn and S; Cu, Zn, and Ca; and yield, K, and P were positive. The variable pH stood apart from the other variables and had an almost opposite direction (180°) to most of the variables, except yield and K. This means that pH had a negative correlation with most of the variables.
| Variables | PC1 | PC2 |
|---|---|---|
| pH | -0.358 | 0.214 |
| EC | 0.320 | 0.264 |
| Yield | -0.221 | -0.379 |
| P | -0.067 | -0.450 |
| K | -0.135 | -0.341 |
| Ca | 0.215 | -0.398 |
| Mg | 0.399 | 0.098 |
| S | 0.349 | -0.159 |
| Na | 0.413 | 0.041 |
| Zn | 0.202 | -0.390 |
| Cu | 0.084 | -0.216 |
| Fe | 0.275 | 0.143 |
| Mn | 0.275 | -0.089 |
3.10 Analysis of the correlation coefficient
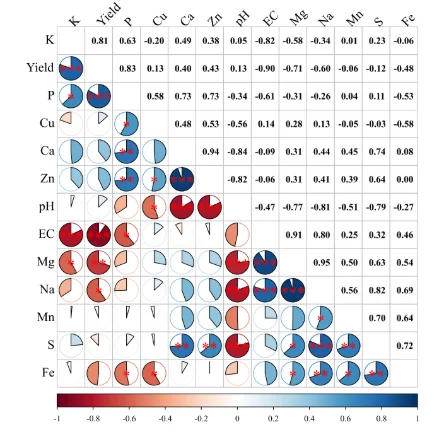
The heatmap in Fig. 9 shows the Pearson correlation matrix of the analyzed variables, where blue color indicates positive and red indicates a negative correlation. Replicate samples (n=15) were used for correlation analysis. Yield showed a very strong positive correlation with K (r= 0.81, p < 0.001) and P (r= 0.83, p < 0.001). Similarly, P exerted a positive correlation with both Ca (r= 0.73, p < 0.01) and Zn (r= 0.73, p < 0.01). Sulfur had a positive correlation with Ca (r= 0.74, p < 0.01), Na (r= 0.82, p < 0.001), Mn (r= 0.70, p < 0.01), and Fe (r= 0.72, p < 0.01). Among all the associations, Zn vs Ca had the strongest correlation (r = 0.94, p < 0.001). On the other hand, pH showed a negative correlation with almost all variables except yield and K. This finding is consistent with the PCA results. Notable negative associations of pH were observed with Ca (r= -0.84, p < 0.001), Zn (r= -0.82, p < 0.001), Mg (r= -0.77, p < 0.001), Na (r= -0.81, p < 0.001), and S (r= -0.79, p < 0.001). Besides, EC had a strong negative correlation with yield (r= -0.90, p < 0.001) and K (r= -0.82, p < 0.001). The variables EC, Mg, Na, Mn, S, Fe, and K, yield, P, Cu, Ca, Zn formed two separate blue color clusters in the heatmap exhibiting close positive relations among the cluster elements. This observation also supports the results of the PCA determination.
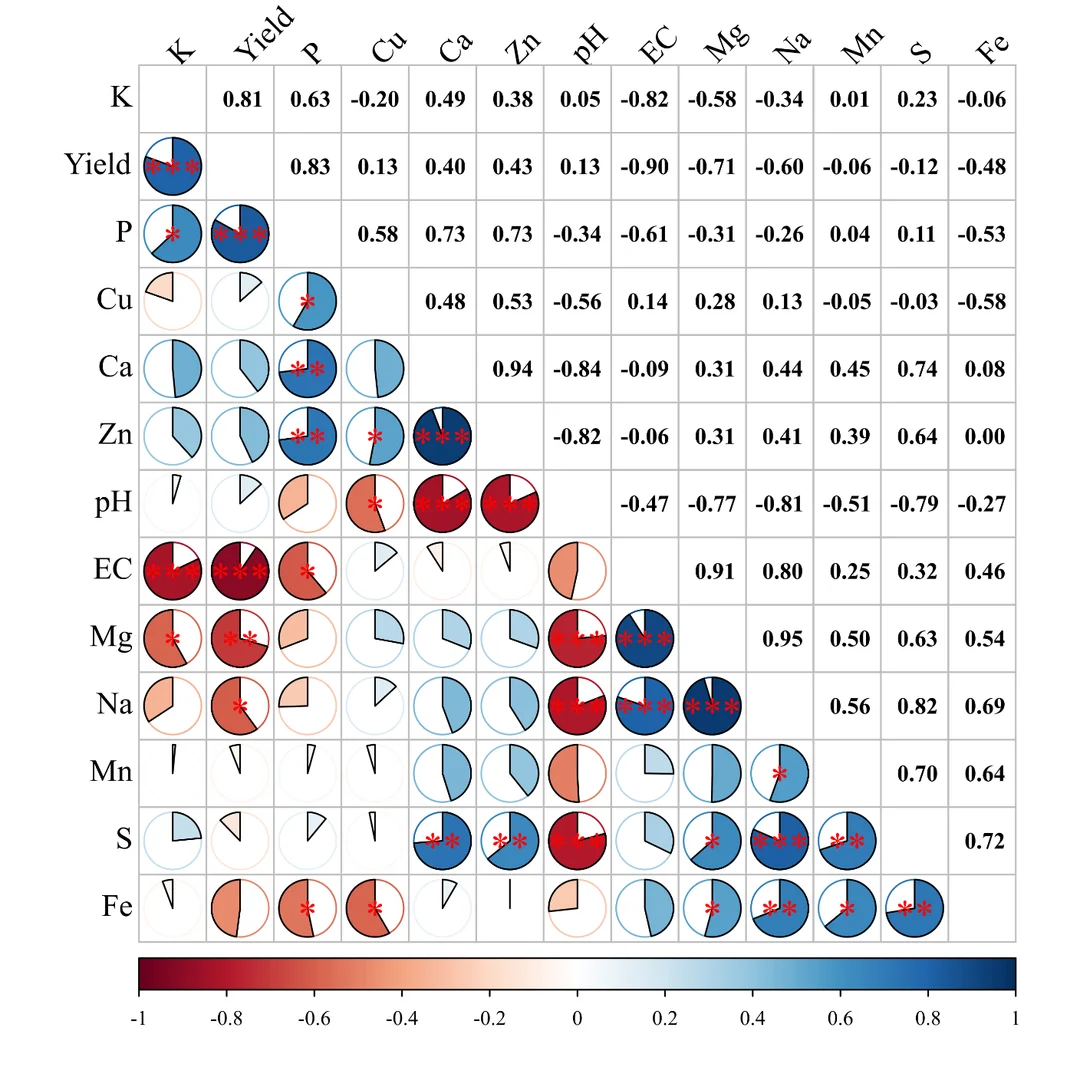
*Note: * p < 0.05, ** p < 0.01, *** < 0.001
4. Study limitations
Although this study successfully assessed the effects of varying soil salinity levels on cabbage yield and mineral concentration in selected coastal areas of Bangladesh, its findings are limited by the evaluation of a single crop season, a limited number of locations, and the absence of detailed physiological, soil quality, and economic analyses. Further multi-season, multi-location, and controlled studies are necessary to validate the results and develop robust recommendations for sustainable cabbage production in saline environments.
5. Conclusions
The EC levels of Dumki, Nauvanga, Pakhimara, Kumirmara in Patuakhali district, and Sawdagarpara in Barguna
district were 0.82, 5.90, 6.82, 7.64, and 9.31 dSm-1, respectively. Across these five coastal study locations,
cabbage yield declined with increasing soil EC and was strongly negatively correlated with EC, while mineral accumulation showed element-specific responses. Moderate-EC locations maintained relatively high yields and concentrations of several mineral nutrients, whereas the highest-EC location generally showed reduced yield and several mineral concentrations. Moreover, cabbage yield showed a strong positive correlation with P and K. The elevated concentrations of K and Na observed in cabbage tissues reflect the complex elemental uptake dynamics across these coastal production systems. The trend in mineral concentration was K > Na > P > S > Mg > Ca > Fe > Zn > Mn > Cu. Therefore, these findings indicate the potential for cabbage production in moderately saline coastal environments; however, controlled multi-season experiments are required to establish salinity tolerance thresholds and separate salinity effects from site-specific soil and management factors.
Acknowledgement
The authors would like to acknowledge the use of Grammarly Premium (Grammarly Inc., San Francisco, CA, USA) for assistance with English language editing, grammar correction, spelling improvement, punctuation refinement, sentence structure enhancement, and the identification of typographical errors during the preparation of this manuscript.
CRediT Author Contribution Statement
Mohammad Ghani Miah: Formal analysis, Investigation, Methodology, Writing - Review & editing. A.K.M. Faruk-E-Azam: Conceptualization, Formal analysis, Investigation, Methodology, Supervision, Visualization, Validation, Writing - Original draft, Writing - Review & editing. Md. Nizam Uddin: Conceptualization, Visualization, Writing - Original draft. Muhammad Maniruzzaman: Methodology, Visualization, Writing - Original draft, Writing - Review & editing. Md Shariful Islam: Data curation, Formal analysis, Software, Writing - Review & editing. Abdullah-Al-Zabir: Formal analysis, Investigation, Methodology, Visualization, Writing - Review & editing. All authors have read and approved the final version of the manuscript for publication and agree to be accountable for all aspects of the work, ensuring that questions related to the accuracy or integrity of any part of the work are appropriately investigated and resolved.
Funding Declaration
This research did not receive any specific grant from funding agencies in the public, commercial, or not-for-profit sectors.
Data Availability Statement
The datasets generated and/or analyzed during the current study that support the findings are available from the corresponding author upon reasonable request.
Conflict of Interest
There is no conflict of interest.
Artificial Intelligence (AI) Use Disclosure
The authors declare that artificial intelligence (AI)-assisted tools were used only for language refinement, grammar improvement, and manuscript structuring purposes during the preparation of this work. All technical content, experimental implementation, results, and interpretations were independently developed and verified by the authors.
Supporting Information
Not applicable.
References
- [1] S. A. Haque, Salinity problems and crop production in coastal region of Bangladesh, Pakistan Journal of Botany, 2006, 38, 1359–1365.
- [2] M. R. Islam, M. Ahmad, M. S. Osman, State of the Coast 2006, Dhaka: Program Development Office for Integrated Coastal Zone Management Plan Project, Water Resources Planning Organization, 2006, https://catalog.hathitrust.org/Record/102434288, Accessed 01 August 2026.
- [3] U. Habiba, M. A. Abedin, R. Shaw, A. W. R. Hassan, Salinity-induced livelihood stress in coastal region of Bangladesh, Community, Environment and Disaster Risk Management, 2013, 13, doi: 10.1108/S2040-7262(2013)0000013013
- [4] M. Hanin, C. Ebel, M. Ngom, L. Laplaze, K. Masmoudi, New Insights on Plant Salt Tolerance Mechanisms and Their Potential Use for Breeding, Frontiers in Plant Science, 2016, 7, 1787, doi: 10.3389/fpls.2016.01787
- [5] S. I. Anik, M. A. S. A. Khan, Climate change adaptation through local knowledge in the north eastern region of Bangladesh, Mitigation and Adaptation Strategies for Global Change, 2012, 17, 879–896, doi: 10.1007/s11027-011-9350-6
- [6] N. T. Hoa, T. Hasegara, Y. Matsuoka, Climate change mitigation strategies in agriculture, forestry and other land use sectors in Vietnam, Mitigation and Adaptation Strategies for Global Change, 2014, 19, 15–32, doi: 10.1007/s11027-012-9424-0
- [7] B. Carmen, D. Roberto, Soil bacteria support and protect plants against abiotic stresses, Abiotic Stress in Plants – Mechanisms and Adaptations, Italy, 2011, 143–170.
- [8] SRDI, Land and Soil Resource Utilization Guide (Thana Nirdeshika in Bengali). Upazila Reports, Dhaka, Ministry of Agriculture, Soil Resource Development Institute, 1994-2002.
- [9] J. Singh, E. V. D. Sastry, V. Singh, Effect of salinity on tomato (Lycopersicon esculentum Mill.) during seed germination stage, Physiology and Molecular Biology of Plants, 2012, 18, 45–50, doi: 10.1007/s12298-011-0097-z
- [10] I. Demir, K. Mavi, M. Ozcoban, G. Okcu, Effect of salt stress on germination and seedling growth in serially harvested aubergine (Solanum melongena L.) seeds during development, Israel Journal of Plant Sciences, 2003, 51, 125–131.
- [11] S. Sharmin, Relative Profitability and Resource Use Efficiency of Participatory and Non-Participatory Farmers of Integrated FSRD Project in Tangail District, M.S. Thesis, Department of Agricultural Economics, Bangladesh Agricultural University, Mymensingh, 2015.
- [12] K. Weinberger, C. Genova II, Vegetable Production in Bangladesh: Commercialization and Rural Livelihoods, 2005.
- [13] C. Genova II, K. Weinberger, T. Chanthasombath, B. Inthalungdsee, K. Sanatem, K. Somsak, Postharvest Loss in the Supply Chain for Vegetables – The Case of Tomato, Yardlong Bean, Cucumber and Chili in Lao PDR, AVRDC Working Paper No. AVRDC, Shanhua, Taiwan: The World Vegetable Center, 2006.
- [14] M. J. Uddin, M.M. Islam, M.N.A. Naher, Basic Agriculture, Part I, 2009, 379.
- [15] FAO STAT: Production/Core Production Data, https://www.fao.org/faostat/en#data/QC, 2018, Accessed 01 August 2026.
- [16] Bangladesh Bureau of Statistics (BBS), Yearbook of Agricultural Statistics of Bangladesh, Dhaka: Statistical Division, Ministry of Planning, Government of the People's Republic of Bangladesh, 1990–2016.
- [17] Bangladesh Agricultural Research Council (BARC), Fertilizer Recommendation Guide, 2018, 96-97.
- [18] M. L. Jackson, Soil Chemical Analysis, New Delhi: Prentice Hall of India Private Limited, 1973, 10–144.
- [19] A. B. Ghosh, J. C. Bajaj, R. Hasan, D. Singh, Soil and water testing methods: A laboratory manual, Division of Soil Science and Agricultural Chemistry, IARI, New Delhi, 1983, 31–36.
- [20] A. J. Walkley, I. A. Black, Estimation of soil organic carbon by the chromic acid titration method, Soil Science, 1937, 29-38.
- [21] J. M. Bremner, Nitrogen total, in Methods of Soil Analysis, Part 3: Chemical Methods, D. L. Sparks (ed). Soil Science Society of America, Madison, Wisconsin, 1996, 1085–1121.
- [22] A. L. Page, R.H. Miller, D.R. Keeney, Eds., Methods of Soil Analysis, Part 2: Chemical and Microbiological Properties, Madison, Wisconsin: American Society of Agronomy/Soil Science Society of America, 1982, 643–698.
- [23] A. B. Ghosh, J. C. Bajaj, R. Hasan, D. Singh, Soil and water testing methods: A laboratory manual, Division of Soil Science and Agricultural Chemistry, IARI, New Delhi, 1983, 21–22.
- [24] APHA, Standard Methods for the Examination of Water and Wastewater, 21st ed., Washington DC: American Public Health Association/American Water Works Association/Water Environment Federation, 2005.
- [25] H. L. S. Tandon, Ed., Methods of Analysis of Soils, Plants, Water, New Delhi: Fertilizer Development and Consultation Organisation, 1995.
- [26] A. L. Page, R.H. Miller, D.R. Keeney, Eds., Methods of Soil Analysis, Part 2: Chemical and Microbiological Properties, Madison, Wisconsin: American Society of Agronomy/Soil Science Society of America, 1982, 431–448.
- [27] A. H. Hunter, Soil Fertility Analytical Services in Bangladesh, Consultancy Report, Dhaka: BARC, 1984.
- [28] N. Tam, M. Yao, Three Digestion Methods to Determine Concentrations of Cu, Zn, Cd, Ni, Pb, Cr, Mn, and Fe in Mangrove Sediments from Sai Keng, Chek Keng, and Sha Tau Kok, Hong Kong, Bulletin of Environmental Contamination and Toxicology, 1999, 62, 708–716, doi: 10.1007/s001289900931
- [29] Z. Z. Lv, G. M. Liu, J. S. Yang, M. M. Zhang, L. D. He, H.B. Shao, S. P. Yu, Spatial variability of soil salinity in Bohai Sea coastal wetlands, China: Partition into four management zones, Plant Biosystems, 2013, 147, 1201–1210, doi: 10.1080/11263504.2013.861531
- [30] United States Department of Agriculture (USDA), National Nutrient Database for Standard Reference, 2011, https://www.nal.usda.gov/fnic/usda-nutrient-data-laboratory, Accessed 29 July 2026.
- [31] R. Munns, Salinity, growth and phytohormones, in Salinity: Environment – Plants – Molecules, Dordrecht: Springer Netherlands, 2002, 271–290.
- [32] B. Takala, Soil Acidity and Its Management Options in Western Ethiopia: Review, Journal of Environment and Earth Science, 2019, doi: 10.7176/jees/9-10-04
- [33] Bangladesh Agricultural Research Council (BARC), Fertilizer Recommendation Guide, Bangladesh Agricultural Research Council, Dhaka, 2005.
- [34] S. De Pascale, A. Maggio, G. Barbieri, Soil salinization affects growth, yield and mineral composition of cauliflower and broccoli, European Journal of Agronomy, 2005, 23, 254–264, doi: 10.1016/j.eja.2004.11.007
- [35] B. Adhikari, O. J. Olorunwa, S. Brazel, T. C. Barickman, R. Bheemanahalli, Impact of salt stress on physiology, leaf mass, and nutrient accumulation in romaine lettuce, Photosynthetica, 2023, 61, 342, doi: 10.32615/ps.2023.027
- [36] D. Samec, I. Linic, B. Salopek-Sondi, Salinity Stress as an Elicitor for Phytochemicals and Minerals Accumulation in Selected Leafy Vegetables of Brassicaceae, Agronomy, 2021, 11, 361, doi: 10.3390/agronomy11020361
- [37] F. E. Azam, M. T. Rahman, M. Maniruzzaman, A. Al Zabir, M. N. Uddin, Nutrients content in some vegetables grown in south-central coastal regions of Bangladesh, The Agriculturists, 2018, 16, 43–57, doi: 10.3329/agric.v16i02.40342
- [38] M. Zeiner, I. J. Cindrić, I. Nemet, K. Franjković, B. S. Sondi, Influence of soil salinity on selected element contents in different Brassica species, Molecules, 2022, 27, 1878, doi: 10.3390/molecules27061878
- [39] J. F. S. Ferreira, J. B. da Silva Filho, X. Liu, D. Sandhu, Spinach Plants Favor the Absorption of K⁺ over Na⁺ Regardless of Salinity, and May Benefit from Na⁺ When K⁺ is Deficient in the Soil, Plants, 2020, 9, 507, doi: 10.3390/plants9040507
- [40] F. Pacheco-Sangerman, F.C. Gómez-Merino, M.G. Peralta-Sánchez, L.I. Trejo-Téllez, Sulfated Nutrition Modifies Nutrient Content and Photosynthetic Pigment Concentration in Cabbage under Salt Stress, Plants, 2024, 13, 1337, doi: 10.3390/plants13101337
- [41] S. Ngxabi, M. O. Jimoh, A. Sogoni, C. P. Laubscher, F. Rautenbach, L. Kambizi, Salinity influenced proximate, minerals, anti‐nutrients and phytochemical composition of Trachyandra ciliata Kunth (wild cabbage): a promising edible halophyte, Food Science & Nutrition, 2025, 13, e4755, doi: 10.1002/fsn3.4755
Publisher Note
Publisher Note: The views, statements, and data in all publications solely belong to the authors and contributors. GR Scholastic is not responsible for any injury resulting from the ideas, methods, or products mentioned. GR Scholastic remains neutral regarding jurisdictional claims in published maps and institutional affiliations.
Open Access
This article is licensed under a Creative Commons Attribution-Non-Commercial 4.0 International License, which permits the non-commercial use, sharing, adaptation, distribution and reproduction in any medium or format, as long as appropriate credit to the original author(s) and the source is given by providing a link to the Creative Commons License and changes need to be indicated if there are any. The images or other third-party material in this article are included in the article's Creative Commons License, unless indicated otherwise in a credit line to the material. If material is not included in the article's Creative Commons License and your intended use is not permitted by statutory regulation or exceeds the permitted use, you will need to obtain permission directly from the copyright holder. To view a copy of this License, visit: https://creativecommons.org/licenses/by-nc/4.0/ © The Author(s) 2026