

 Open Access||Research Article
Design of a PI-Controlled PWM Three-Phase Rectifier for DC Voltage Regulation in Low-Speed PMSG Wind Energy Systems
Ika Noer Syamsiana1 , Raditya Pratito1, Rahma Nur Amalia1, Asfari Hariz Santoso1, Arwin Datumaya Wahyudi Sumari2
1 Electrical Power Systems Study Program, Department of Electrical Engineering, State Polytechnic of Malang, Malang, 65141, East Java, Indonesia
2 Office of Special High-Rank Officer, Indonesian Air Force Headquarters, Jakarta Timur, DKI Jakarta, 13870, Indonesia
Abstract
Wind energy in Malang, Indonesia, generally has low wind speeds, causing voltage fluctuations in the outputs of permanent magnet synchronous generators (PMSGs). This study aims to design and evaluate a three-phase rectifier based on pulse width modulation (PWM) with a proportional-integral (PI) controller to improve DC voltage stability in low-speed wind energy conversion systems. Evaluation was carried out through MATLAB/Simulink and Proteus simulations with variations in the input voltage, duty cycle, and resistive (R) and resistive–inductive (R–L) load conditions. The simulation results revealed that under open-loop conditions, the maximum DC voltage was close to the theoretical value of 64.8 V. At the same time, the duty cycle variation affected the minimum voltage and produced a voltage ripple of approximately 9–10%. The PI controller reduces the voltage ripple to approximately 1–3% and improves the stability of the DC output voltage at input voltages of 36 V and 48 V. The results show that the PI controller can improve the regulatory performance of the PWM rectifier voltage under varying input voltage and load conditions. This study contributes to the development of a PMSG-based wind energy conversion system for areas with low wind potential. Although this study is based on simulation results, it provides a basis for further experimental validation to evaluate the performance of the proposed system under real operating conditions.
Keywords
Graphical Abstract
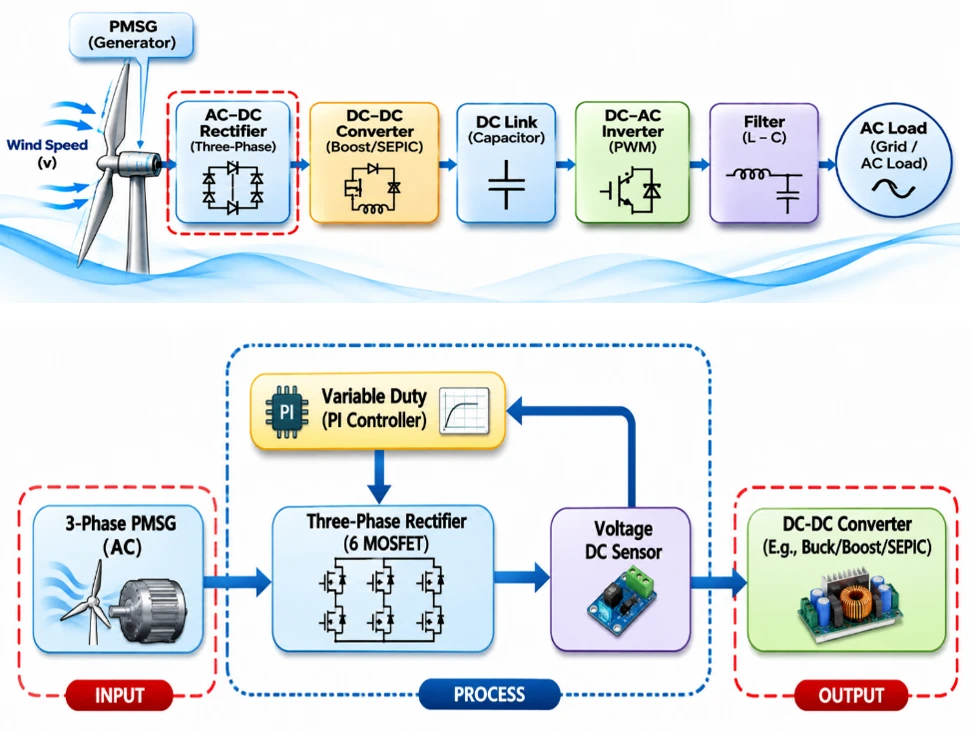
Novelty Statement
This study presents an application-specific PI-controlled PWM three-phase rectifier for regulating the DC output of a low-speed PMSG wind energy system. Its contribution lies in identifying the effects of PWM duty-cycle variation on V_minand DC voltage ripple under variable input-voltage and R/R–L load conditions and demonstrating that closed-loop PI control reduces ripple from approximately 9–10% to 1–3%. Cross-platform evaluation using MATLAB/Simulink and Proteus confirms the effectiveness of the proposed design under input voltages of 36 and 48 V.
1. Introduction
The global and national energy crisis has accelerated the transition to sustainable renewable energy sources. Dependence on fossil fuels not only raises concerns about resource scarcity but also significantly exacerbates greenhouse gas emissions and climate change.[1] As a vast archipelagic country with abundant natural resources, Indonesia has experienced increasing energy consumption alongside a growing demand for renewable energy. Indonesia possesses substantial renewable energy reserves, with an estimated total capacity of 419 GW. These reserves include 75 GW from hydropower, 23.7 GW from geothermal energy, 32.6 GW from bioenergy, 207.8 GW from solar energy, 60.6 GW from wind energy, and 19.3 GW from microhydro sources .[2]
Wind energy in Indonesia is recognized as a viable renewable resource because of its considerable potential, estimated at approximately 60.6 GW. However, the installed capacity remains limited to approximately 157 MW, with a target of 255 MW by 2025.[2] More recent data from the Ministry of Energy and Mineral Resources of the Republic of Indonesia indicate an even greater national potential of approximately 154.6 GW, while the installed capacity by 2024 had only reached approximately 152.3 MW, concentrated mainly in high-wind regions such as South Sulawesi (the 75 MW Sidrap and 72 MW Jeneponto wind farms); the government targets an additional 5 GW of wind capacity by 2030 under the 2025–2035 National Electricity Supply Business Plan (ESBP), while low-wind regions such as East Java have not yet been prioritized for development.[3] A more recent comprehensive review corroborates these figures and highlights that the country's wind development remains geographically concentrated, with most remaining potential still unexploited outside a handful of high-wind provinces.[4] This limitation is largely due to relatively low average wind speeds, which restrict large-scale power generation, as well as insufficient extensive studies and confidence in selecting optimal sites, particularly in remote and offshore areas.[5] Innovations such as low-wind-speed turbines are being researched to increase wind energy utilization in regions with low wind speeds in Indonesia, potentially making wind power economically competitive with fossil fuels.[6] The minimum wind speed required to generate power is 3 m/s. Wind performance varies across three locations: Sampang, Surabaya, and Nganjuk. The annual average wind speeds in Sampang, Surabaya, and Nganjuk are 2.34 m/s, 3.03 m/s, and 1.97 m/s, respectively. Wind in these regions can generate 1,284 MW, 1,008 MW, and 1,199 MW per year, assuming a constant temperature coefficient of approximately 6%. The capacity factors of the wind power plants in Sampang, Nganjuk, and Surabaya are 30.02%, 30.01%, and 30.00%, respectively. These activities could reduce greenhouse gas emissions by 0.904, 0.709, and 0.846 tons of CO2 per year in the surrounding atmosphere.[7] These wind speed data indicate that Indonesia generally has low wind speeds.
In East Java Province, particularly in Malang city, the wind energy potential is characterized by relatively low and variable average wind speeds of approximately 3–6 m/s. This condition presents challenges for Wind Power Plants (WPGP), especially during the conversion of mechanical energy into electrical energy. Currently, permanent magnet synchronous generators (PMSGs) are widely used in power generation because of their high efficiency. However, the flux density of permanent magnets decreases with increasing temperature, complicating voltage management; hybrid-excitation PMSG designs have been proposed to counteract this temperature sensitivity while keeping the generator’s output voltage within safe limits across varying wind speeds.[8] Wind energy conversion systems (WECSs) based on a PMSG connected to the grid have been proposed and implemented. The possibility of achieving shorter pole pitches allows machines to operate at low speeds, eliminating the need for gearboxes or enabling the use of single-stage gears for more compact designs.[9]
The relationship between the fluctuations in the wind speed and the electrical output of a PMSG can be explained through basic wind-energy physics. The kinetic energy contained in a moving mass of air is proportional to the square of the wind speed:
where m is the mass of air and v is the wind speed; consequently, the power extracted from the wind is proportional to the cube of the wind speed,
where ρ is the air density and A is the swept area of the turbine blades.[10] Because the wind speed in low-wind regions such as Malang fluctuates continuously within a narrow range, even small variations in v produce relatively large variations in the mechanical power delivered to the PMSG shaft. This fluctuating mechanical input directly translates into a fluctuating electrical frequency and voltage at the PMSG terminals since the generator’s output voltage and frequency are proportional to its rotational speed. As a result, the DC voltage produced after rectification also fluctuates so that the voltage and frequency characteristics of the PMSG output are strongly influenced by fluctuations in the wind speed, making rectifiers and control systems crucial for efficiently maintaining power quality.
Three-Phase Rectifiers are crucial in Wind Power Plant (WPGP) systems for converting three-phase AC voltage from Permanent Magnet Synchronous Generators (PMSG) into stable DC voltage. The use of conventional rectifiers without control systems often leads to significant issues, including high current harmonics, DC voltage ripple, and reduced power conversion efficiency. These conditions degrade power quality, cause power losses, and negatively impact the components and overall performance of wind power plant (WPGP) systems.[11] Indrianto and Hariyadi’s research demonstrated that three-phase rectifiers operating with resistive–inductive loads generate significant current harmonics, which adversely affect the power quality of electrical systems.[12] Therefore, the integration of pulse width modulation (PWM) along with control systems is essential in power conversion systems.
1.1. Related work
Previous studies on three-phase rectifier control for PMSG-based and general power conversion systems can be grouped according to their control approach. A first group of studies examined passive or diode-based rectifiers connected to PMSG wind turbines; Rahimi modeled a grid-connected PMSG wind turbine assisted by a diode rectifier and boost converter and reported that although simple and low-cost, such uncontrolled rectifiers provide no means of regulating the DC-link voltage and are strongly affected by variations in generator speed and load, whereas Tchoumtcha et al. proposed a synergetic control scheme for a stand-alone PMSG that simultaneously regulates current, maximum power extraction, and DC-link voltage under fluctuating load and uncertain turbine parameters.[13,14] A second group focused on active or PWM-based rectifiers as an alternative to passive rectification; Alili et al. demonstrated that a Vienna-rectifier-based PWM converter connected to a PMSG wind turbine can regulate DC-link voltage more effectively than a passive rectifier, while Rajaei et al. further showed that Vienna-rectifier topologies reduce switching and conduction losses for low-power PM-based wind energy conversion systems; in the same vein, Annisa et al. simplified firing-angle generation for a three-phase controlled rectifier through a Simulink-based cosine-comparator gate-control logic, Acikgoz et al. combined a type-2 fuzzy neural network with artificial-bee-colony optimization to regulate the DC-link voltage of a three-phase PWM rectifier under unbalanced supply and regenerative-mode conditions, and Li et al. proposed a model-predictive direct power control method that reduces the computational burden of PWM rectifier control without sacrificing regulation accuracy.[15-19] A third group of studies investigated proportional-integral (PI) control applied at the DC-link or rectifier output; Bouafia et al. combined fuzzy logic and PI control for direct power control of a three-phase PWM rectifier to regulate the output voltage; Sanchis and Peñarrocha-Alós proposed an experimental step-response-based tuning method for PI controllers; and Zhou et al. reported that a well-tuned PI controller can maintain a near-sinusoidal input current with low distortion while preserving system power-factor reliability.[20-22] Furthermore, Nurwati et al. reinforced that discrete PI control in PWM rectifiers can significantly enhance system performance.[23] Beyond rectifier-specific applications, similar trial-and-error and optimization-based PI tuning approaches have proven effective for other power-electronic converters that supply wind and renewable-energy loads; Chincholkar et al. introduced a normalized-error PI controller to overcome saturation limitations in a DC-DC buck converter; Uc et al. validated PI-gain optimization using local-and-global search algorithms on a DC-DC boost converter; and Mrabet et al. compared trial-and-error Kp/Ki optimization against metaheuristic tuning for a wind-energy MPPT controller, reinforcing that trial-and-error PI tuning remains a practical and sufficiently accurate baseline for this class of system.[24-26] A fourth group examined rectifier control performance under variations in speed, input voltage, and load; Shwetha and Guruswamy applied a whale-optimization-algorithm-tuned PI controller to a three-phase PWM rectifier and achieved a rise time of 0.0126 s, a settling time of 0.06 s, and a DC voltage ripple below 3%, whereas Alzahrani compared controlled and uncontrolled rectifiers for low-power wind turbines and reported that fully controlled rectifiers provide a wider regulation range under varying firing angles at the cost of additional control-circuit complexity.[27,28] Finally, a fifth group of studies validated their proposed control strategies across multiple platforms, combining MATLAB/Simulink simulation with either circuit-level software or physical hardware testing to confirm consistency between numerical and experimental results.[22,27,28] However, most of these studies were conducted under highly stable source conditions and do not accurately reflect the characteristics of wind power generation at low and variable wind speeds.
1.2. Research gap
Previous research has developed various rectifier topologies and control methods for wind energy conversion systems based on permanent magnet synchronous generators (PMSGs).[29-31] However, studies on the effects of the duty cycle-varying PWM on the DC output voltage and voltage ripple under open-loop conditions, especially across input voltages representing changes in the wind speed, still need further investigation. In addition, the influence of resistive (R) and resistive–inductive (R–L) load characteristics, as well as the effectiveness of proportional–integral (PI) controllers in improving DC voltage stability and reducing ripples compared with uncontrolled conditions, requires quantitative evaluation of the same rectifier configuration. Studies integrating system-level simulation in MATLAB/Simulink and circuit-level simulation in Proteus should also be developed to provide a more comprehensive performance analysis. Therefore, this study evaluates PWM-based three-phase rectifiers with PI controllers across various input voltages, duty cycles, and R and R–L loads by comparing open-loop and closed-loop performance. This study's main contribution is a quantitative evaluation of DC voltage regulation and voltage-ripple reduction across two simulation platforms, providing a basis for developing and experimentally validating low-speed PMSG-based wind energy conversion systems.
1.3. Proposed solution
To address these gaps, in this study, a PI-controlled PWM three-phase rectifier intended for a low-speed PMSG wind energy system is designed. The control variable is the DC output voltage of the rectifier, which is regulated by adjusting the PWM duty cycle applied to the six MOSFET switches on the basis of the error between the reference voltage and the measured DC output. The system is first analyzed under open-loop conditions with manually set duty cycles of 30%, 50%, 74%, and 95% to characterize the rectifier's inherent behavior and subsequently evaluated under closed-loop PI control at three-phase input voltages of 48 V and 36 V, which are used as representative operating points for higher- and lower-wind-speed conditions, respectively (see Section 2.2 regarding the fixed-voltage-source representation of the PMSG input), rather than being derived from a calibrated wind-speed-to-voltage PMSG model. Both resistive (R) and resistive-inductive (R-L) loads are tested to evaluate the influence of load characteristics on system performance. System-level control design and PI tuning are performed in MATLAB/Simulink, while circuit-level performance, including the output voltage waveform, current, power, and ripple, is evaluated using Proteus.
1.4. Research objective
This study aims to design and evaluate a PI-controlled PWM three-phase rectifier for regulating the DC output voltage of a low-speed PMSG wind energy system under variable input-voltage, duty-cycle, and load conditions.
1.5. Main contribution
The main contributions of this study are as follows: (1) an application-specific PI-controlled PWM three-phase rectifier design for low-speed PMSG operation; (2) a comparative assessment of open-loop and closed-loop responses under different input voltages, duty cycles, and R/R-L loads; and (3) a cross-platform evaluation using MATLAB/Simulink and Proteus, demonstrating a reduction in the DC voltage ripple from approximately 9–10% to 1–3%.
2. Methods
Testing and data collection in this study were carried out by varying the three-phase source voltage (Vin) and load conditions Resistive (R) and Resistive-Inductive (RL) and then observing the output results in the form of the DC voltage, current, power, and voltage ripple for each test condition. The following are the testing parameters used shown in Table 1.
Table 1: Testing Parameters
| NO | Input Voltage Variation (Vin) | Duty Cycle Variation (%) | Resistive Load Variations (R) | Resistive-Inductive Load Variations (Z) |
|---|---|---|---|---|
| 1. | 48 V | 30% 50% 74% 95% | 450 Ω 650 Ω 1000 Ω | 1936 Ω (1548 Ω + 3,7 H) 645 Ω (516 Ω + 1,23 H) 323 Ω (258 Ω + 0,62 H) |
| 2. | 36 V | 30% 50% 74% 95% | 450 Ω 650 Ω 1000 Ω | 1936 Ω (1548 Ω + 3,7 H) 645 Ω (516 Ω + 1,23 H) 323 Ω (258 Ω + 0,62 H) |
In the data analysis stage, data need to be collected to assess the performance of the three-phase rectifier is shown in Table 2. All measurements listed in Table 2 (Multimeter, Oscilloscope) were performed using Proteus's built-in virtual instruments during circuit-level simulation, not physical hardware devices; no physical multimeter or oscilloscope was used to produce the results reported in this study.
Table 2: Analysis Parameters
| No | Parameter | Measuring tool | Test |
|---|---|---|---|
| 1. | Voltage | Multimeter | Set the potentiometer to measure DC voltage. Connect the multimeter probe to the rectifier output terminals. Check the result on the display. |
| 2. | Voltage graph | Oscilloscope | Connect the oscilloscope probe to the rectifier output terminal. Change the rectifier's PWM duty cycle and observe the voltage waveform on the display. |
| 3. | Voltage Ripple | Oscilloscope | Connect the oscilloscope probe to the rectifier output terminal. Change the rectifier's PWM duty cycle and watch the voltage graph on the display to detect any ripple. |
| 4. | Current | Multimeter | Adjust the potentiometer to measure the current. Connect the multimeter probe in series with the positive DC terminal and monitor the current flowing to the load. |
| 5. | Electric power | Calculation | The power on the load is obtained from Ohm's law calculations, which is the result of multiplying the measured DC voltage by the load current. |
All measurements listed in Table 2 (Multimeter, Oscilloscope) were performed using Proteus's built-in virtual instruments during circuit-level simulation, not physical hardware devices; no physical multimeter or oscilloscope was used to produce the results reported in this study.
2.1. Research framework
The stages of this research follow the flow shown in Fig. 1. This study begins with a literature review on PI-controlled PWM three-phase rectifiers for low-speed PMSG wind energy systems, followed by the conceptual design of the control system. The control system is then implemented and tested; if the test result is not yet satisfactory, the design is revised and reimplemented, and the cycle is repeated until the control system performs as intended. Once the control system design is successful, data collection is carried out for all test conditions (duty cycle, input voltage, and load variations), followed by data analysis and, finally, the formulation of conclusions.
2.2. System configuration
The block diagram of the overall low-speed WPGP system considered in this study is shown in Fig. 2. Wind energy is captured by the wind turbine and converted into three-phase AC voltage by the PMSG. This AC voltage is converted into DC voltage by the three-phase rectifier, which is the focus of this study; the resulting DC voltage is subsequently stepped down and regulated by a buck converter before being used to charge a 24 VDC battery and, through an inverter, supply the AC load; the buck-converter-to-battery charging stage follows the general charge/discharge control strategies reviewed for renewable-energy storage systems in Banguero et al.[32] The configuration of the three-phase rectifier subsystem is shown in Fig. 3: the PMSG (represented by a three-phase AC source of 48 V or 36 V) supplies the three-phase rectifier built from six MOSFET switches; the rectifier's DC output is measured by a voltage sensor of the resistive-divider type described in Jittakort and Aurasopon’s study for accurate low-cost embedded voltage/current sensing, and this measurement is fed back to an Arduino UNO running the PI control algorithm, which adjusts the PWM duty cycle applied to the MOSFET switches so that the output voltage is regulated toward the desired setpoint.[33]
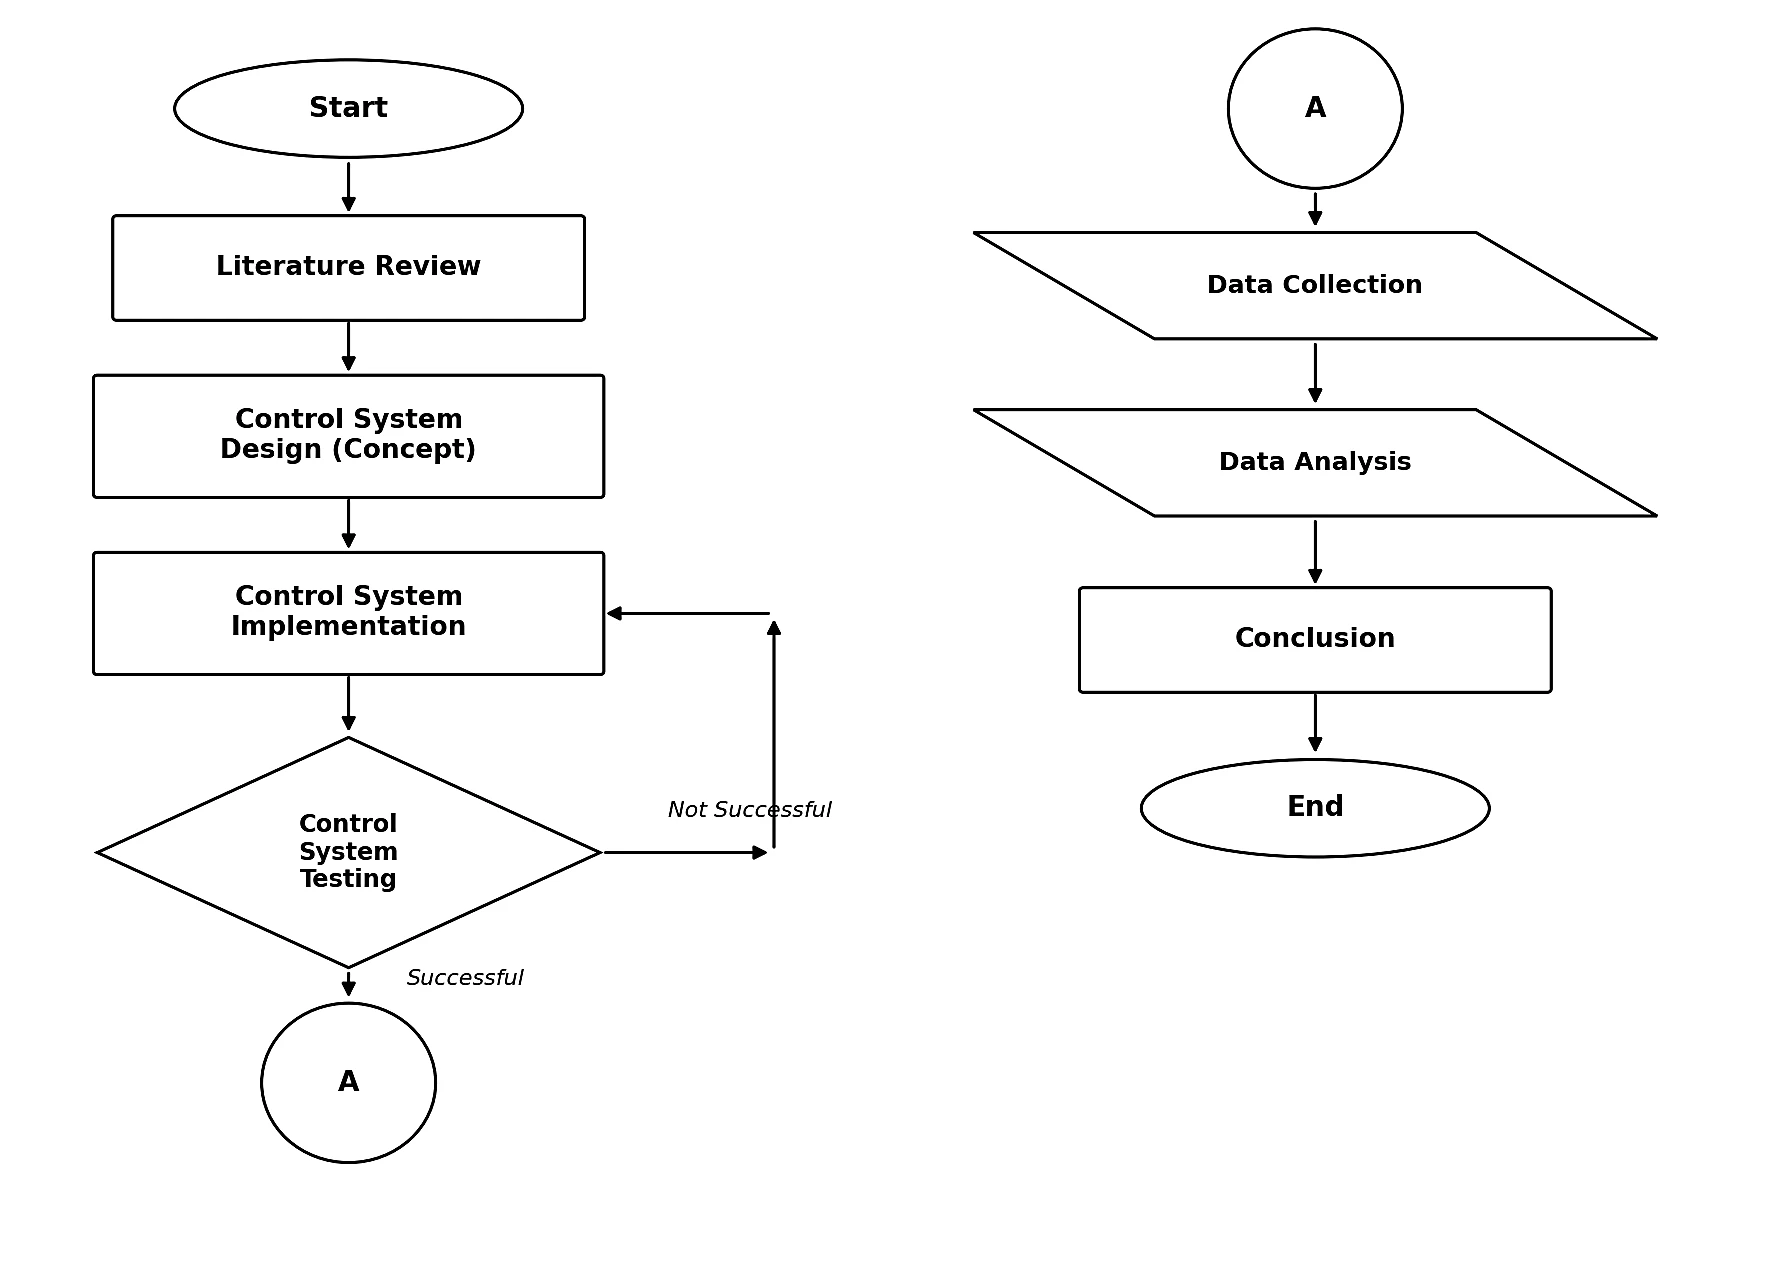
Fig. 1: Research flowchart.
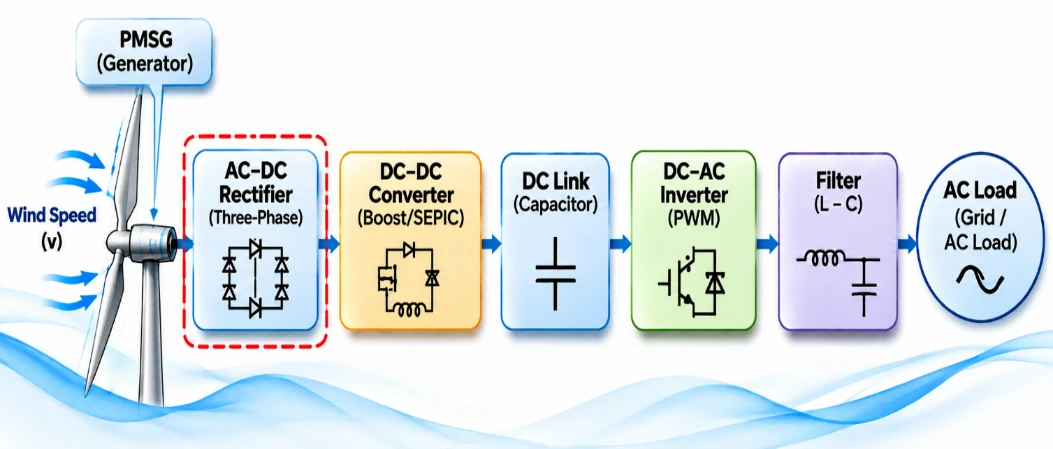
Fig. 2: Overall Low-Speed WPGS system block diagram.
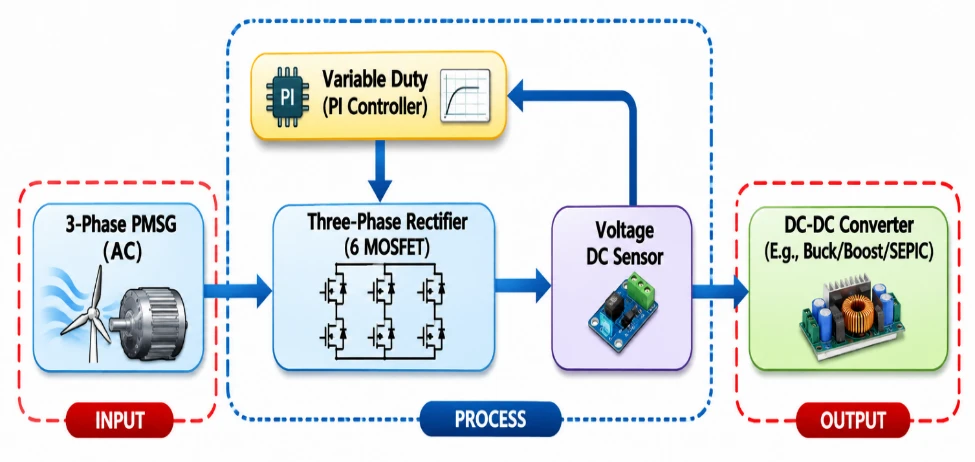
Fig. 3: Three-Phase rectifier subsystem block diagram closed-loop system.
The closed-loop control structure is shown in Fig. 4. A 48 V (or 36 V) reference/setpoint voltage is compared with the measured DC output voltage at a summing junction to produce an error signal. This error is processed by the PI controller running on the Arduino UNO, whose output determines the PWM duty cycle applied to the three-phase rectifier (the plant). The output voltage of the rectifier is continuously measured by the voltage sensor and returned as the feedback signal, allowing the controller to keep the output voltage close to the setpoint despite variations in load or input voltage.
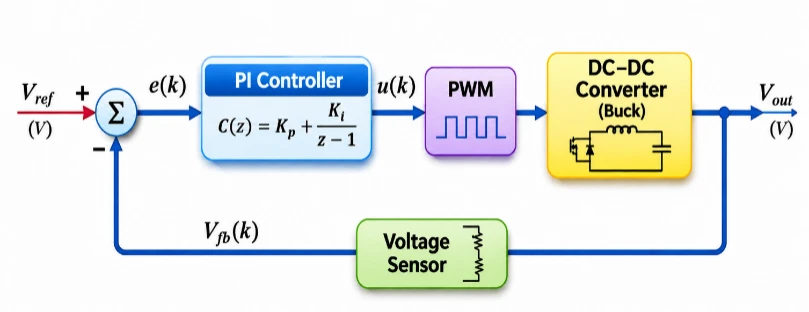
Fig. 4: Closed-Loop PI control block diagram.
2.3. Three-Phase PWM rectifier design
The three-phase rectifier is built using six MOSFET switches arranged in a three-phase full-bridge configuration, switched according to a PWM pattern generated by the Arduino UNO and applied through three IR2110 gate-driver ICs; the Arduino UNO program controlling this PWM pattern runs with a fixed sampling time of 10 ms, as implemented in the Proteus circuit simulation shown in Fig. 5. A DC-link capacitor is connected at the rectifier output to smooth the rectified voltage before it reaches the load; on the basis of the ripple-tolerance design calculation, the required capacitance was 0.0062 F (6200 µF), and since a 6200 µF capacitor was not commercially available, the closest standard value, 6800 µF, was selected for implementation. The PWM carrier (triangular-wave) signal that drives the six MOSFET switches is generated at a fixed switching frequency of 5 kHz. Under ideal, unmodulated six-pulse rectification, the theoretical DC output voltage is given by Eq. 6 in Section 3 (Vdo = (3√2/π) × VAC). The rectifier output is tested using resistive (R) loads of 450 Ω, 650 Ω, and 1000 Ω and resistive-inductive (R-L) loads of 1548 Ω + 3.7 H, 516 Ω + 1.23 H, and 258 Ω + 0.62 H, as summarized in Table 1.
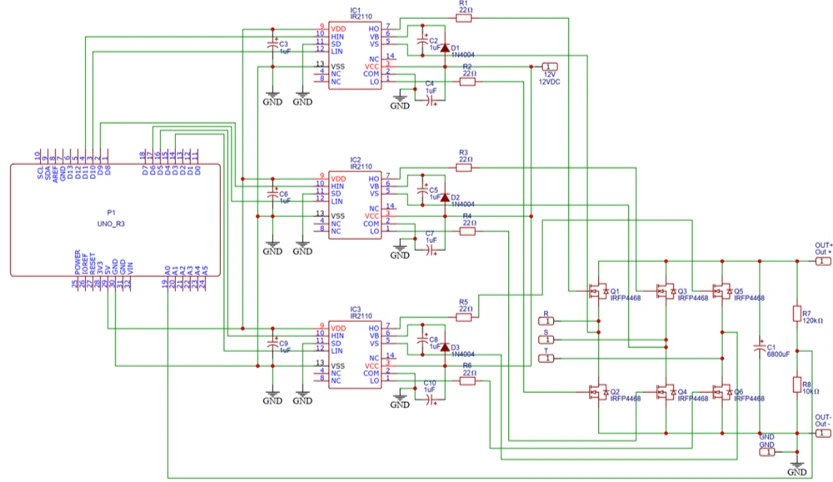
Fig. 5: Proteus simulation circuit of the three-phase PWM rectifier.
2.4. Open-Loop PWM operation
Under open-loop operation, the PWM duty cycle is set manually (30%, 50%, 74%, and 95%) without any voltage feedback so that the inherent behavior of the rectifier can be characterized independently of the controller. Each duty cycle is tested at a three-phase input voltage of 48 V with every R and R-L load listed in Table 1, and the maximum voltage (Vmax), minimum voltage (Vmin), current, power, and voltage ripple are recorded for each condition. All the results reported in this study were obtained entirely through simulation: system-level control design and PI-gain tuning were carried out in MATLAB/Simulink, and circuit-level verification (output voltage waveform, current, power, and ripple) was carried out in Proteus. No physical hardware prototype was used to produce the results reported in this manuscript.
2.5. Design and tuning of the PI controller
The PI controller output is computed from the P equation and the I equation, where e(t) is the error between the reference voltage (Sp) and the measured output voltage (Pv):
The gains in Kp and Ki were obtained through the trial-and-error tuning method described in Section 2 (increasing Kp to speed up the response and then increasing Ki to remove steady-state error). The MATLAB/Simulink model of the closed-loop PI-controlled rectifier is shown in Fig. 6. In the MATLAB/Simulink model, the PI controller output (modulation index) is bounded by a saturation block with an upper limit of +1 and a lower limit of -1 before being used to generate the PWM switching signals. In the corresponding embedded implementation, the Arduino UNO program (executed within the Proteus circuit simulation) maps this modulation index to its native 8-bit PWM range (0–255), corresponding linearly to a 0–100% duty cycle. A rate limit block in the Simulink model restricts the rate of change of the modulation index to ±0.5 per second to prevent the controller from overreacting (oscillating) to ripple in the feedback signal, thereby improving the overall stability of the control system. The final gains in Kp and Ki obtained for every tested condition (input voltage, load type, and load value), together with the resulting closed-loop Vmax, Vmin, current, power, and ripple, are listed in Table 3. In the MATLAB/Simulink model, no fixed sample time was manually configured; the simulation instead ran using Simulink's automatic (variable-step) solver setting.
The Kp and Ki gains were tuned separately for each combination of input voltage and load (Table 3), not as a single fixed gain set. In each case, Kp first increased until the output voltage responded quickly, and Ki subsequently increased to remove the steady-state error, whereas the output-voltage response remained stable under the load being tuned (Section 3.1). The tuning was therefore empirical: no transfer-function-based design, formal stability analysis, or optimization algorithm was applied, and the gains in Table 3 (Kp = 0.27–1.61; Ki = 0.14–2.88) are not claimed to be optimal, and their spread between conditions reflects this per-condition tuning.
Table 3: Closed-Loop PI controller performance - full detail (R and R-L, 48 V and 36 V)
| Vin (V) | Load | Kp | Ki | Vmax (V) | Vmin (V) | Current (A) | Power (W) | Ripple (%) |
|---|---|---|---|---|---|---|---|---|
| 48 | 450 Ω (R) | 1.05 | 0.5 | 66.5 | 60.1 | 0.14 | 8.862 | 2.9 |
| 48 | 650 Ω (R) | 0.27 | 0.68 | 66.3 | 60.3 | 0.1 | 6.33 | 2.7 |
| 48 | 1000 Ω (R) | 0.94 | 2.05 | 66 | 59.9 | 0.06 | 3.777 | 2.8 |
| 48 | 1548 Ω + 3.7 H (R-L) | 1.61 | 2.43 | 66.1 | 60.8 | 0.04 | 2.538 | 2.4 |
| 48 | 516 Ω + 1.23 H (R-L) | 1.56 | 2.88 | 66.2 | 60.5 | 0.12 | 7.602 | 2.6 |
| 48 | 258 Ω + 0.62 H (R-L) | 1.45 | 0.69 | 66.2 | 60.0 | 0.25 | 15.775 | 2.8 |
| 36 | 450 Ω (R) | 0.5 | 0.5 | 49.4 | 46.8 | 0.1 | 4.81 | 1.6 |
| 36 | 650 Ω (R) | 1.07 | 1.86 | 49.3 | 46.6 | 0.07 | 3.3565 | 1.6 |
| 36 | 1000 Ω (R) | 1.12 | 1.23 | 48.6 | 46.9 | 0.04 | 1.91 | 1.0 |
| 36 | 1548 Ω + 3.7 H (R-L) | 0.63 | 0.14 | 49.2 | 46.2 | 0.03 | 1.431 | 1.8 |
| 36 | 516 Ω + 1.23 H (R-L) | 1.13 | 0.9 | 49.4 | 46.6 | 0.09 | 4.32 | 1.7 |
| 36 | 258 Ω + 0.62 H (R-L) | 1.25 | 1.66 | 49.4 | 46.5 | 0.19 | 9.1105 | 1.7 |
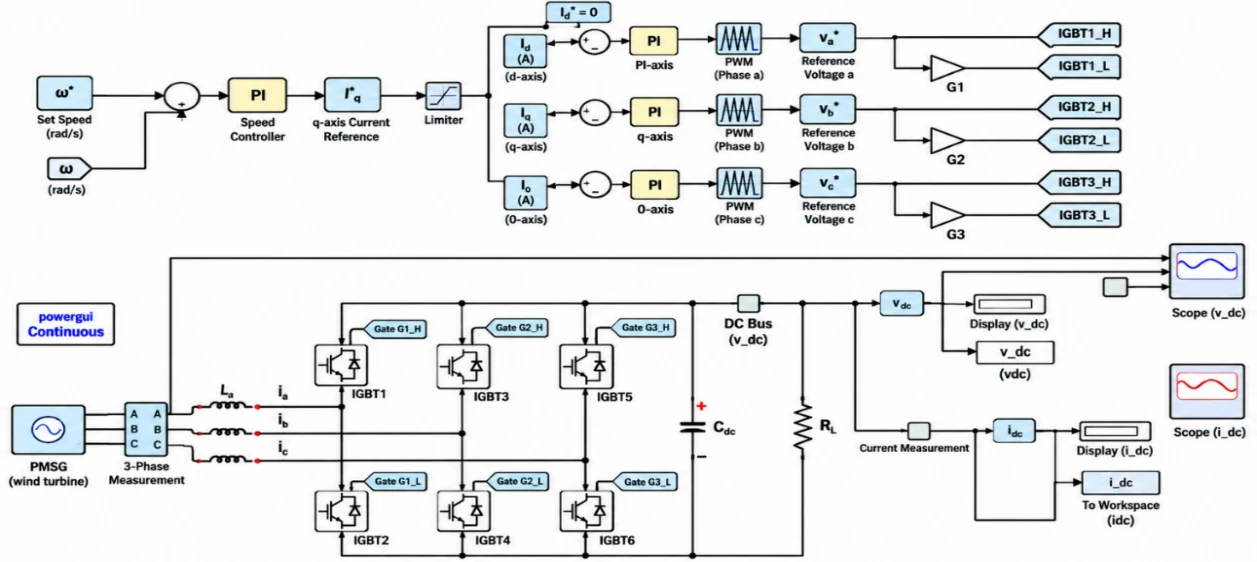
Fig. 6: MATLAB/Simulink model of the Closed-Loop PI-Controlled PWM rectifier.
3. Results and discussion
3.1. Open-Loop PWM rectifier performance
Testing was carried out in two stages, namely, the tuning stage and the data collection stage. In the initial stage, MATLAB/Simulink was used to tune the proportional (Kp) and integral (Ki) parameters of the PI controller through the trial and error method so that the values of Kp and Ki were obtained to ensure a stable output voltage response under various load conditions. After the optimal Kp and Ki values were obtained, the final testing and data collection stage was conducted using Proteus, which was employed to evaluate the performance of the three-phase rectifier circuit comprehensively through circuit-level simulation, including the output voltage waveform, current, power, and ripple across different duty cycles, input voltages (Vin), and load types. In this study, waveform testing was performed using an oscilloscope with two measurement channels, namely, Channel A and Channel B, each functioning to observe signals at different measurement points in the circuit. The use of two channels aimed to allow simultaneous observation of the rectifier output voltage and the PWM switching signal within a single display. The following is an explanation of each channel used.
Duty cycle testing using a resistive load
This test aims to determine the effect of varying PWM duty cycles on the rectifier’s output voltage under open-loop conditions (without a PI controller) using a purely resistive load (R). The duty cycle variations tested were 30%, 50%, 74%, and 95%, with a three-phase input voltage (Vin) of 48 V.
Duty cycle variation = 30%
Table 4 lists the measured Vmax, Vmin, current, power, and ripple of the three resistive loads at a 30% duty cycle, and Figs. 7–9 show the corresponding output waveforms for the 450 Ω, 650 Ω, and 1000 Ω loads, respectively.
Table 4: Resistive load test data - Duty = 30%
| Duty cycle width (%) | Load | Test data | ||||
|---|---|---|---|---|---|---|
| Vmax(V) | Vmin(V) | Current(A) | Power(W) | Ripple (%) | ||
| Linear load (resistor/r (Ω)) | ||||||
| 30% | 450 | 66.1 | 62.4 | 0.15 | 9.915 | 1.7% |
| 650 | 66.3 | 61.5 | 0.1 | 6.63 | 2.2% | |
| 1000 | 66.1 | 62.9 | 0.06 | 3.966 | 1.4% | |
Duty cycle variation = 50%
Table 5 lists the measured Vmax, Vmin, current, power, and ripple of the three resistive loads at a 50% duty cycle, and Figs. 10–12 show the corresponding output waveforms for the 450 Ω, 650 Ω, and 1000 Ω loads, respectively.
Table 5: Resistive load test data - Duty = 50%
| Duty cycle width (%) | Load | Test data | ||||
|---|---|---|---|---|---|---|
| Vmax(V) | Vmin(V) | Current(A) | Power(W) | Ripple (%) | ||
| Linear load (resistor/r (Ω)) | ||||||
| 50% | 450 | 66.2 | 49.8 | 0.15 | 9.93 | 8.2% |
| 650 | 66.1 | 48.5 | 0.1 | 6.61 | 8.9% | |
| 1000 | 65.8 | 48.7 | 0.06 | 3.948 | 8.6% | |
Duty cycle variation = 74%
Table 6 lists the measured Vmax, Vmin, current, power, and ripple of the three resistive loads at a 74% duty cycle, and Figs. 13–15 show the corresponding output waveforms for the 450 Ω, 650 Ω, and 1000 Ω loads, respectively.
Table 6: Resistive load test data - Duty = 74%
| Duty cycle width (%) | Load | Test data | ||||
|---|---|---|---|---|---|---|
| Vmax(V) | Vmin(V) | Current(A) | Power(W) | Ripple (%) | ||
| Linear load (resistor/r (Ω)) | ||||||
| 74% | 450 | 65.6 | 47.5 | 0.14 | 9.184 | 9.2% |
| 650 | 65.8 | 47.9 | 0.1 | 6.58 | 9.1% | |
| 1000 | 65.3 | 46.7 | 0.06 | 3.918 | 9.6% | |
Duty cycle variation = 95%
Table 7 lists the measured Vmax, Vmin, current, power, and ripple of the three resistive loads at a 95% duty cycle, and Figs. 16–18 show the corresponding output waveforms for the 450 Ω, respectively.
Table 7: Resistive load test data - Duty = 95%
| Duty cycle width (%) | Load | Test data | ||||
|---|---|---|---|---|---|---|
| Vmax(V) | Vmin(V) | Current(A) | Power(W) | Ripple (%) | ||
| Linear load (resistor/r (Ω)) | ||||||
| 95% | 450 | 64.7 | 47 | 0.15 | 9.705 | 9.1% |
| 650 | 65.4 | 47.2 | 0.1 | 6.54 | 9.3% | |
| 1000 | 65.6 | 48 | 0.06 | 3.936 | 8.9% | |
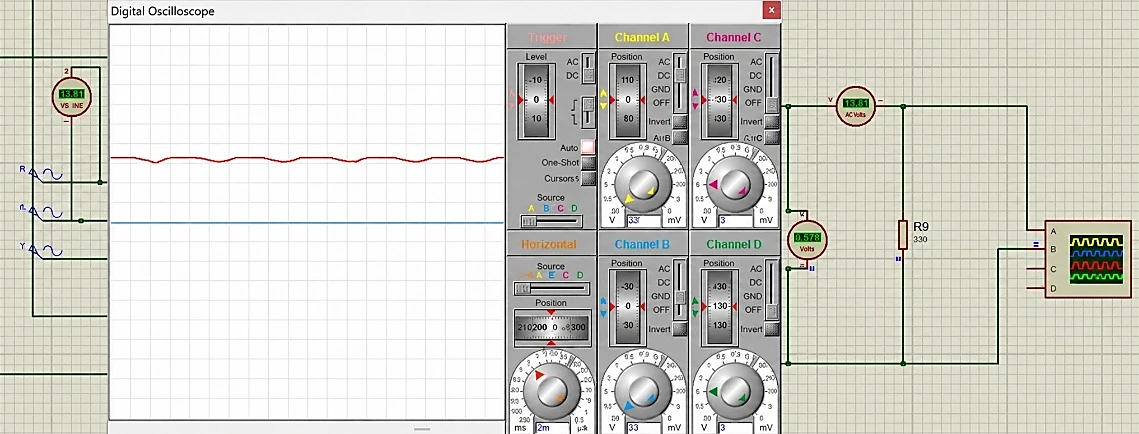
Fig. 7: Resistive load waveform 450Ω - Duty = 30%
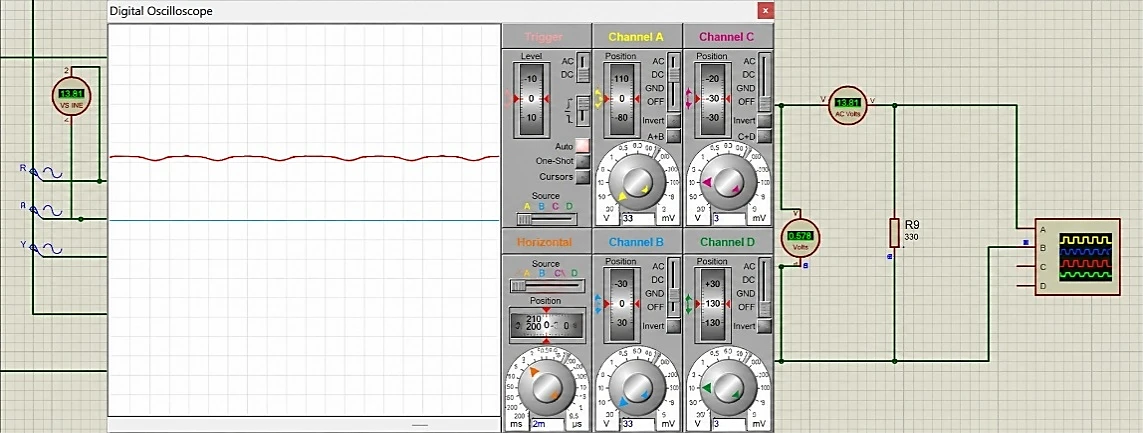
Fig. 8: Resistive load waveform 650Ω - Duty = 30%
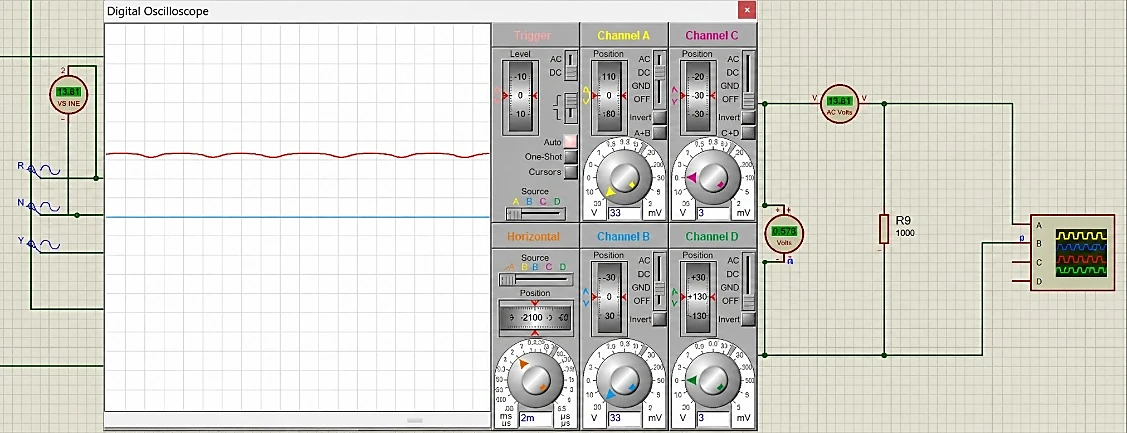
Fig. 9: Resistive load waveform 1000Ω - Duty = 30%
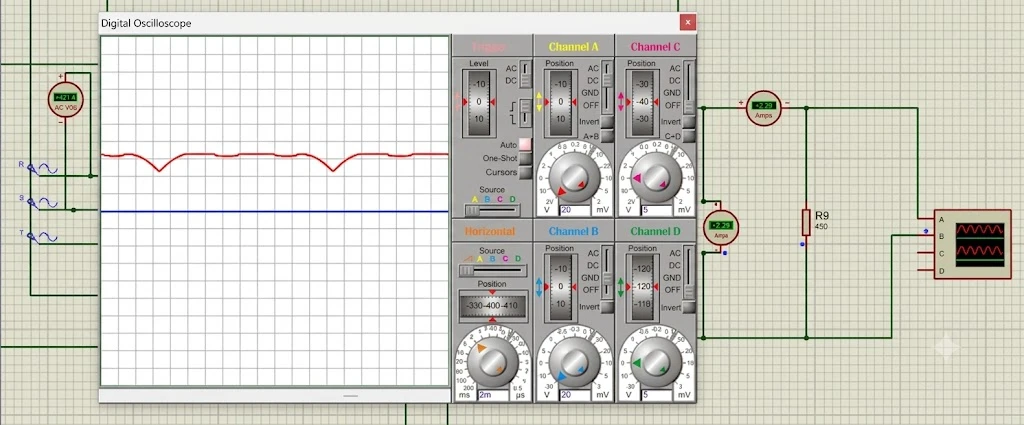
Fig. 10: Resistive load waveform 450Ω - Duty = 50%
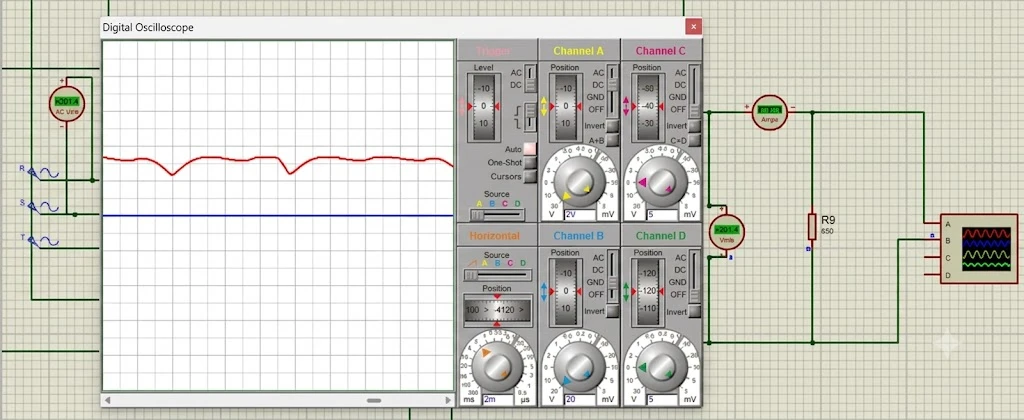
Fig. 11: Resistive load waveform 650Ω - Duty = 50%
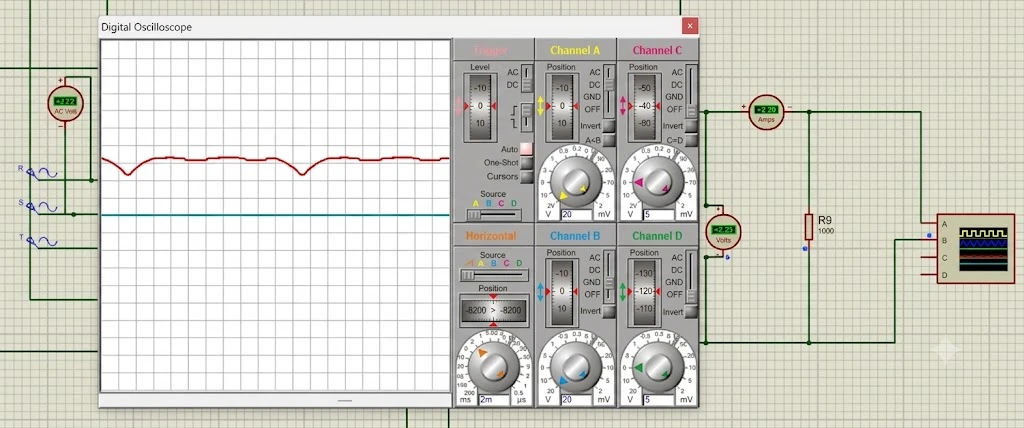
Fig. 12: Resistive load waveform 1000Ω - Duty = 50%
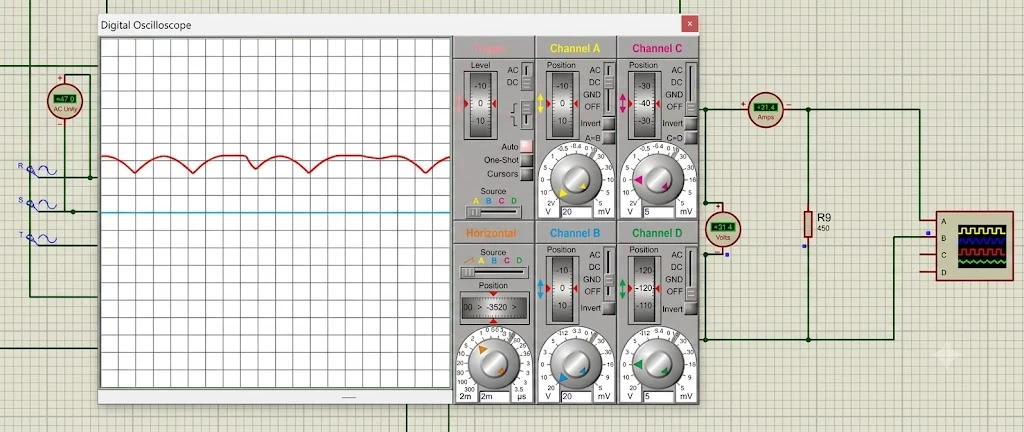
Fig. 13: Resistive load waveform 450Ω - Duty = 74%
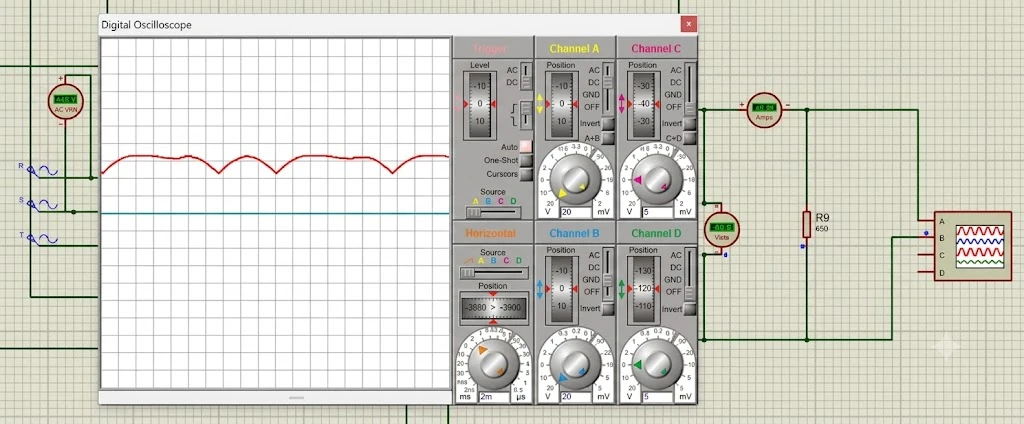
Fig. 14: Resistive load waveform 650Ω - Duty = 74%
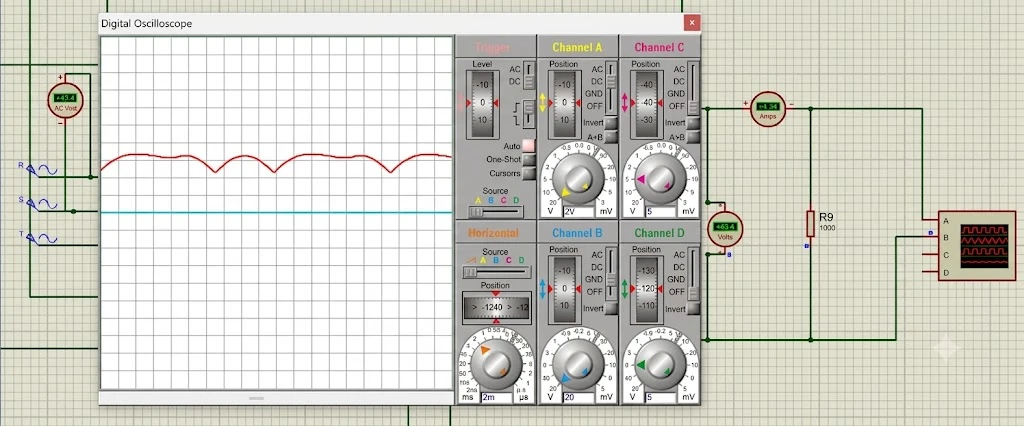
Fig. 15: Resistive load waveform 1000Ω - Duty = 74%
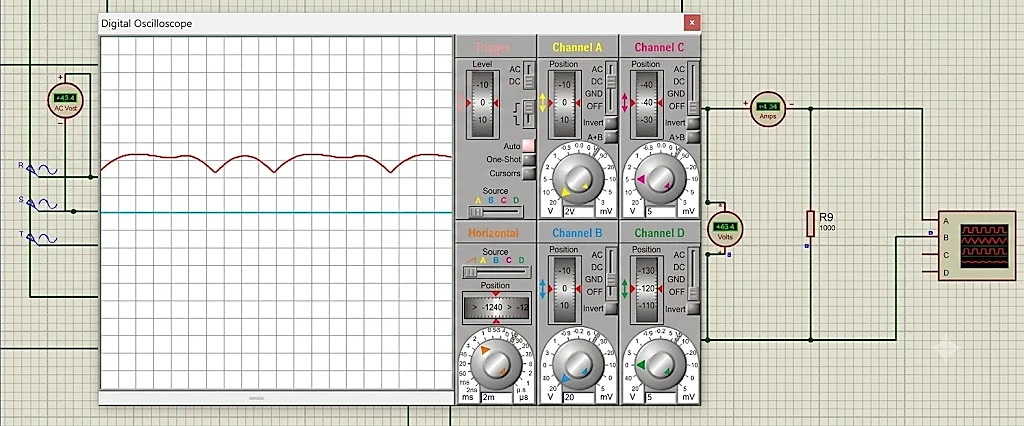
Fig. 16: Resistive load waveform 450Ω - Duty = 95%
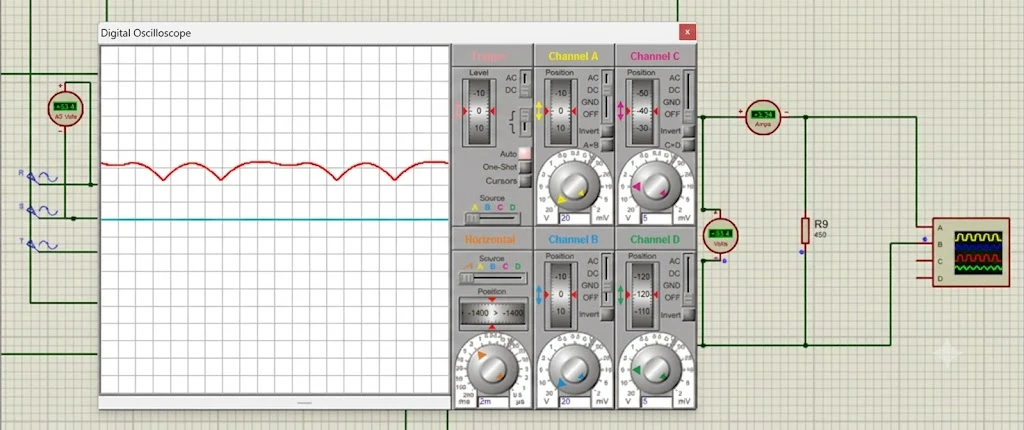
Fig. 17: Resistive load waveform 650Ω - Duty = 95%
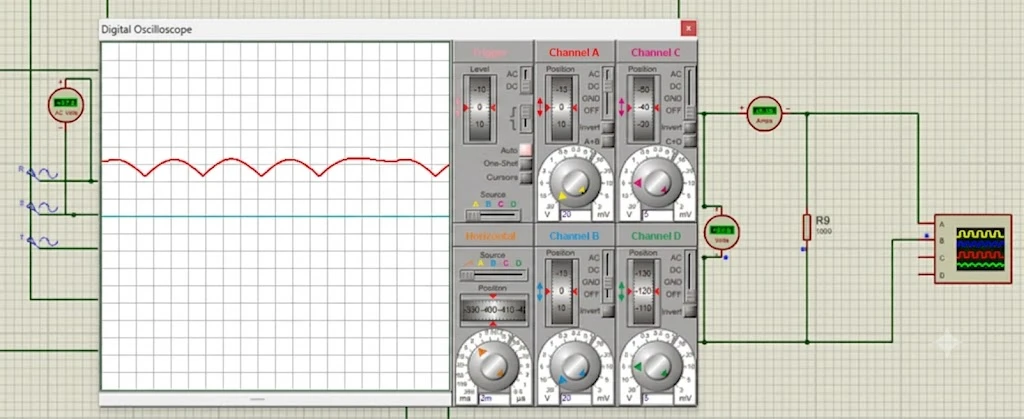
Fig. 18: Resistive load waveform 1000Ω - Duty = 95%
Duty Cycle testing using a Resistive-Inductive load
This test aims to determine the effect of varying PWM duty cycles on the output voltage of the rectifier under open-loop conditions (without a PI controller) using a resistive-inductive load (R-L). The duty cycle variations tested were 30%, 50%, 74%, and 95%, with a three-phase input voltage (Vin) of 48 V for each of the three R-L load values in Table 1. The results are listed in Table 8.
Table 8: Resistive–Inductive load test data (All Duty Cycles)
| Duty (%) | Load | Vmax (V) | Vmin (V) | Current (A) | Power (W) | Ripple (%) |
|---|---|---|---|---|---|---|
| 30 | 1548 Ω + 3.7 H | 66.2 | 61.8 | 0.04 | 2.648 | 2 |
| 30 | 516 Ω + 1.23 H | 66.2 | 61.4 | 0.13 | 8.606 | 2.2 |
| 30 | 258 Ω + 0.62 H | 66.4 | 61.6 | 0.25 | 16.6 | 2.2 |
| 50 | 1548 Ω + 3.7 H | 65.6 | 47.8 | 0.04 | 2.624 | 9.1 |
| 50 | 516 Ω + 1.23 H | 66 | 49.1 | 0.13 | 8.58 | 8.5 |
| 50 | 258 Ω + 0.62 H | 66 | 49.3 | 0.25 | 16.5 | 8.4 |
| 74 | 1548 Ω + 3.7 H | 65.5 | 48.8 | 0.04 | 2.62 | 8.4 |
| 74 | 516 Ω + 1.23 H | 65.4 | 47.9 | 0.12 | 7.848 | 8.9 |
| 74 | 258 Ω + 0.62 H | 65 | 47.5 | 0.25 | 16.25 | 9 |
| 95 | 1548 Ω + 3.7 H | 65.3 | 48 | 0.04 | 2.612 | 8.8 |
| 95 | 516 Ω + 1.23 H | 65 | 47.2 | 0.12 | 7.8 | 9.2 |
| 95 | 258 Ω + 0.62 H | 64.8 | 46 | 0.25 | 16.2 | 9.8 |
The R-L loads show the same ripple trend across duty cycles as the resistive loads in Tables 4–7; the two load types are compared in Section 3.4.
3.2. Analysis of Open-Loop Duty-Cycle effects
Analysis was conducted to evaluate the effect of varying the PWM duty cycle width on the output voltage (VDC) under open-loop conditions. The data used were average values obtained from testing with resistive and resistive-inductive loads at an input voltage of 48 V, and these data were compared with the theoretical
DC voltage of a 6-pulse rectifier. The theoretical voltage value (Vdo) can be formulated as follows.
With:
= Theoretical DC voltage of a 6-pulse rectifier (V)
= Peak-to-average voltage conversion factor (constant 3√2/π)
= AC Voltage (V)
Table 9 compares the measured Vmax, Vmin, and average VDC with the theoretical Vdo for each duty cycle, where the average VDC is the mean over the six loads of (Vmax + Vmin)/2.
Table 9: Duty cycle variation to output voltage
| Duty(%) | Vmax(V) | Vmin (V) | VDC Average (V) | Vdo Theory (V) | Error Vmax to Vdo (%) |
|---|---|---|---|---|---|
| 30 | 66,1 – 66,4 | 61,4 – 62,9 | 64,1 | 64,8 | +2,0% s.d. +2,5% |
| 50 | 65,6 – 66,2 | 47,8 – 49,8 | 57,4 | 64,8 | +1,2% s.d. +2,2% |
| 74 | 65,0 – 65,8 | 46,7 – 48,8 | 56,6 | 64,8 | +0,3% s.d. +1,5% |
| 95 | 64,7 – 65,6 | 46,0 – 48,0 | 56,2 | 64,8 | -0,2% s.d. +1,2% |
The data shown in Table 9 indicate that Vmax remains relatively constant across all duty cycle variations (64.7–66.4 V) and is close to the theoretical value of Vdo = 64.8 V, with an error margin of less than 2.5%. This finding demonstrates that Vmax is determined by the peak waveform of the 6-pulse rectifier rather than by the duty cycle width. Conversely, Vmin decreases significantly as the duty cycle increases, from 61.4–62.9 V at a 30% duty cycle to approximately 46–49 V at duty cycles between 50% and 95%. This reduction in Vmin substantially decreases the average VDC, from 64.1 V at a 30% duty cycle to approximately 56–57 V at duty cycles of 50% or greater. This phenomenon is evident in Fig. 19, where the output voltage across all load conditions both resistive and resistive-inductive converges at each duty cycle point. This highlights that changes in the output voltage (Vout) are more strongly influenced by variations in the duty cycle than by the type or magnitude of the load used.
In Fig. 19, the output voltage of all six loads sharply decreases, by approximately 7–8 V, from a 30% to a 50% duty cycle and then remains nearly constant up to 95%. At a 30% duty cycle, the six loads yield VDC values of 63.8–64.5 V, very close to the DC output voltage of the rectifier, Vdo = 64.8 V, whereas at duty cycles of 50–95%, the VDC of all the loads stabilizes at approximately 55.4–58 V. Analysis was carried out to evaluate the effect of varying the PWM duty cycle width on the ripple in the output voltage (VDC) under open-loop conditions. The ideal ripple factor of a 6-pulse rectifier without a filter is approximately 4.2%, indicating that the measured ripple does not originate from the natural rectification process but rather from the interaction between PWM switching and the capacitor filter. The ripple value can be formulated as follows.
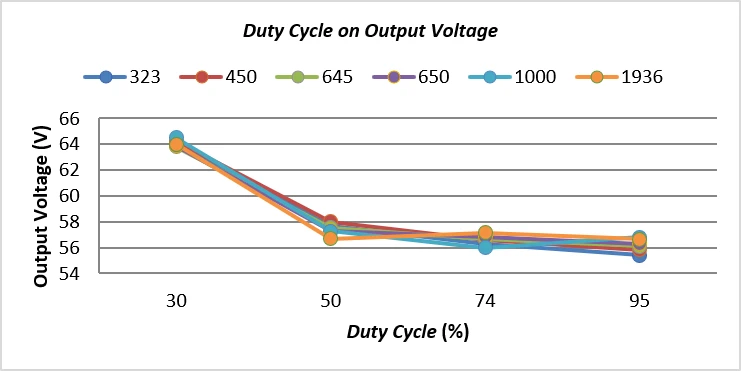
Fig. 19: Variation of duty cycle on output voltage
At a 30% duty cycle, a 450 Ω resistive load is used.
With:
= Peak-to-peak ripple value (V)
= Peak Voltage on the Graph (V)
= Lowest Voltage on the Graph (V)
= RMS value of the ripple (V)
The ripple is evaluated from the Vmax and Vmin read on the oscilloscope waveform (Figs. 7–18) because the capacitor-filtered output consists of repeated charge–discharge arcs, so its AC component can be characterized by the peak-to-peak value. The RMS value of this ripple is approximated by Vpp/(2√3), which is exact for a triangular waveform, and is normalized by the mean value (Vmax + Vmin)/2 so that the result is a ripple factor comparable with the 4.2% of the ideal six-pulse rectifier.[34] This approximation was checked against that of the ideal case: for an unfiltered six-pulse output, Vmax = Vp and Vmin = Vp cos 30°, so Eqs. 8 and 9 give 4.15%, within approximately 1.2% (relative) of the exact value of 4.20% obtained from RF = √(FF² − 1).[34] Figs. 8 and 9 give 4.15%, within approximately 1.2% (relative) of the exact value of 4.20% obtained from RF = √(FF² − 1).[34] For the same arc-shaped waveform, for which the waveforms in Figs. 13–18 resemble, the true RMS value of the AC component is 0.299 Vpp, approximately 3.6% above the triangular approximation (0.289 Vpp), whereas the sinusoidal approximation Vpp/(2√2) (0.354 Vpp) would overestimate the ripple by approximately 22% (for example, 9.8% would become approximately 12%). Because the same method is applied to every open-loop and closed-loop condition, the ripple values in Tables 3–8 and 10 are mutually consistent and comparable; they remain estimates from the Vmax and Vmin readings since the recorded waveforms were not integrated numerically. The calculation of ripple values for each test variation was carried out according to the method applied in this study. The results of the calculations for each testing condition are presented in the following table. The results are summarized in Table 10.
Table 10: Duty cycle variation to Ripple
| Duty (%) | Ripple P-P(V) | Ripple RMS(V) | Ripple (%) | Ripple Factor 6-Pulse 6 Theory | Gap to Ceiling (pp) |
|---|---|---|---|---|---|
| 30 | 3,2 – 4,8 | 0,92 – 1,39 | 1,4% – 2,2% | 4,2% | -2,8 pp s.d. -2,0 pp |
| 50 | 16,4 – 17,8 | 4,73 – 5,14 | 8,2% – 9,1% | 4,2% | +4,0 pp s.d. +4,9 pp |
| 74 | 16,7 – 18,6 | 4,82 – 5,37 | 8,4% – 9,6% | 4,2% | +4,2 pp s.d. +5,4 pp |
| 95 | 17,3 – 18,8 | 4,99 – 5,43 | 8,8% – 9,8% | 4,2% | +4,6 pp s.d. +5,6 pp |
The data in Table 10 indicate that the ripple increases between the 30% and 50% duty cycles (rising from 1.4%–2.2% to 8.2%–9.1%) and then tends to remain stable, although it slightly increases from the 50% to 95% duty cycles. Moreover, each ripple value at duty cycles between 50% and 95% significantly exceeds the theoretical ripple factor for a 6-pulse rectifier (4.2%), with differences reaching 4% to 5.6%.
The same trend is shown graphically in Fig. 20: the ripple of all six loads increases from 30% to 50% of the duty cycle and then remains nearly constant, and the overlapping lines indicate that the ripple is governed by the duty cycle rather than by the load type or magnitude. Because the ripple at duty cycles of 50–95% is well above 4.2% of the unfiltered six-pulse rectifier, it is attributed to the interaction between PWM switching and the RC filter, as noted above, rather than to the rectification process itself.
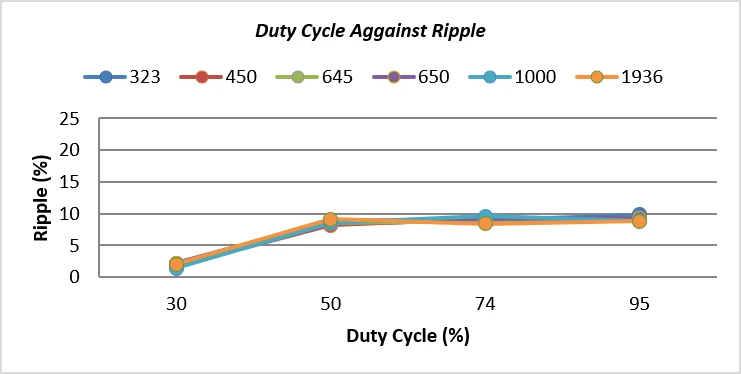
Fig. 20: Duty cycle variation against Ripple.
3.3. Effect of Input-Voltage Variation and Closed-Loop PI-Controlled performance
Analysis was conducted to evaluate the effects of changes in three-phase input voltages (48 V and 36 V) on the output voltage (VDC) under closed-loop conditions using a proportional-integral (PI) controller with Kp and Ki values obtained through trial-and-error tuning. The data used were average values obtained from testing with resistive and resistive-inductive loads, and these were compared with the theoretical DC voltage of a 6-pulse rectifier. The theoretical voltage value (Vdo) can be formulated as follows.
At an input voltage condition of 48 V
At an input voltage condition of 36 V
With:
= Theoretical DC voltage of a 6-pulse rectifier (V)
= Peak-to-average voltage conversion factor (constant 3√2/π)
= AC Voltage (V)
Table 3 presents the complete closed-loop test results for every combination of input voltage (48 V, 36 V), load type (R, R-L), and load value, including the Kp and Ki gains used for each condition. The ripple values in Table 3 are given with one decimal and are recomputed from the listed Vmax and Vmin with Eqs. 7–9 for consistency with the open-loop tables; a comparison with the open-loop ripple is discussed in Section 3.5. Table 11 shows that the Vmax values from the Proteus simulation closely approach the theoretical Vdo under both input voltage (Vin) conditions, with an error margin of only +2.19% at Vin = 48 V and +1.28% at Vin = 36 V. These findings are consistent with those of the duty cycle analysis in Section 3.2, which demonstrated that Vmax is influenced primarily by the peak of the rectified waveform rather than by the control parameters applied. In other words, regardless of the efforts of the proportional-integral (PI) controller to adjust the duty cycle, the output voltage remains “maintained” around its theoretical limit. The average value in Table 11 is the mean of the Vmax values of the six loads in Table 3; thus, the error expresses the deviation of Vmax from Vdo.
Table 11: Input voltage variations compared to theory
| VAC(V) | Theory Vdo(V) | Vmax Range(V) | Average Vmax(V) | Error (%) |
|---|---|---|---|---|
| 48 | 64,80 | 66,0 – 66,5 | 66,22 | +2,19% |
| 36 | 48,60 | 48,6 – 49,4 | 49,22 | +1,28% |
Table 12 shows that the ratio of Vmin to the input voltage remains nearly constant at 1.26 for Vin = 48 V and 1.29 for Vin = 36 V. Hence, even when the input voltage falls from 48 V to 36 V, Vmin remains proportionally close to the peak of the rectified waveform, which indicates that the PI controller operates consistently at both input-voltage operating points (representing higher and lower wind speeds) and avoids the large decrease in Vmin observed under open-loop operation at higher duty cycles (Section 3.2).
Table 12: Interpretation and Vmin Ratio to Input Voltage
| VAC (V) | Average Vmin (V) | Vmin Ratio (VAC) | Interpretation |
|---|---|---|---|
| 48 | 60,27 | 1,26 | Ripple is pressed near the natural peak of the rectifier. |
| 36 | 46,60 | 1,29 | Consistent – The PI control still keeps Vmin near the rectifier's natural peak even when VAC drops. |
The lines for all resistive and resistive–inductive loads nearly overlap at both input voltages: the output voltage (VDC) decreases from approximately 63 V (62.95–63.45 V) at Vin = 48 V to approximately 48 V (47.7–48.1 V) at Vin = 36 V. The closed-loop response therefore follows the input voltage and is not noticeably affected by the load type or magnitude (Fig. 21).
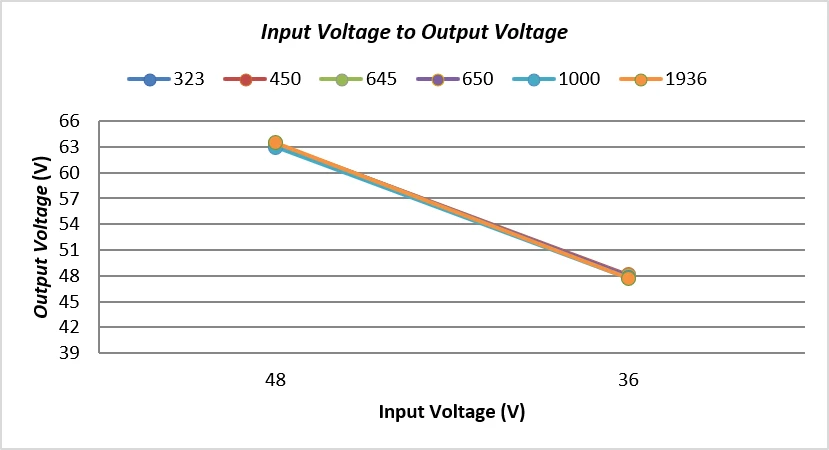
Fig. 21: : Input voltage variation to output voltage
3.4. Effect of load characteristics (Resistive vs. Resistive-Inductive Loads)
A comparison between resistive (R) and resistive-inductive (R-L) loads under open-loop duty-cycle testing at Vin = 48 V (Tables 4–8) reveals that the load type has only a minor effect on the ripple. At a 30% duty cycle, the R-L loads produced a ripple of 2.0–2.2%, close to the 1.4–2.2% obtained with R loads; at duty cycles of 50–95%, the R-L ripple (8.4–9.8%) and the R-load ripple (8.2–9.6%) were in the same range. The load currents differed (0.04–0.25 A for R-L versus 0.06–0.15 A for R) because the load resistances differed (258–1548 Ω versus 450–1000 Ω), but this did not result in a different ripple or Vmin trend. Hence, as concluded in Section 3.2, the open-loop ripple is governed primarily by the PWM duty cycle rather than by the type or magnitude of the connected load.
3.5. Open-Loop and Closed-Loop comparison
Table 13 summarizes the open-loop and closed-loop results side by side. Under open-loop operation, the voltage ripple ranged from approximately 1.4% at a 30% duty cycle to nearly 9.8% at duty cycles of 50–95% for both R and R-L loads. After the PI controller was applied under closed-loop operation, the ripple was reduced to approximately 2–3% at Vin = 48 V and approximately 1–2% at Vin = 36 V for both R and R-L loads (see Table 3 for the full per-condition breakdown), i.e., an overall range of approximately 1–3% across the tested input voltages and load types. This demonstrates that compared with open-loop operation, closed-loop PI control provides a substantial and consistent improvement in the DC output quality, regardless of the load characteristics. This comparison is limited to steady-state voltage ripple, which is consistent with the scope of the underlying thesis, which evaluates only steady-state conditions; transient-response metrics such as rise time, settling time, and overshoot were not computed and are not included in this study.
Table 13: Open-Loop and Closed-Loop comparison
| Operating Condition | Control Mode | Ripple (%) |
|---|---|---|
| Vin = 48 V, R/R-L, duty 30% | Open-loop | 1.4-2.2 |
| Vin = 48 V, R/R-L, duty 50-95% | Open-loop | 8.2-9.8 |
| Vin = 48 V, R/R-L | Closed-loop (PI) | 2-3 |
| Vin = 36 V, R/R-L | Closed-loop (PI) | 1-2 |
4. Conclusion
The test results revealed that under open-loop conditions, the maximum output voltage (Vmax) of the three- phase rectifier tends to remain stable in the range of 64.7 V to 66.4 V, which is close to the theoretical value of Vdo = 64.8 V, with an error margin below 2.5%. This finding indicates that Vmax is influenced primarily by the inherent characteristics of the 6-pulse rectifier waveform rather than by changes in the duty cycle. On the other hand, the minimum voltage (Vmin) and ripple are strongly affected by the duty cycle, as the ripple increases rapidly from approximately 2% at a 30% duty cycle to nearly 10% at duty cycles between 50% and 95%, which is far above the theoretical limit of 4.2%. After the proportional-integral (PI) control system was applied under closed-loop conditions, the ripple was reduced to only 1%–3% across various input voltage conditions, indicating that, in the simulations, this control system maintained the output voltage with low ripple across the tested conditions. These findings confirm that the objectives of this study have been achieved. A PWM controller based on proportional-integral (PI) is designed and modeled, consisting of six MOSFETs, an Arduino UNO, and three IR2110 driver ICs, and is tested through MATLAB/Simulink and Proteus simulations only. The proportional-integral (PI) control system was also successfully implemented through a voltage feedback scheme that automatically adjusts the duty cycle, and its performance was tested using Proteus simulations covering voltage, current, ripple, and power. This study demonstrates that the quality assessment of the PWM-based rectifier output cannot be judged solely by the peak voltage but must consider the effect of the duty cycle on the minimum voltage and ripple. Fundamentally, these simulation results indicate that a proportional-integral (PI) control system tuned using the trial and error method can serve as a simple yet sufficient approach to maintaining DC voltage stability in low-speed wind power generation systems (WPGS). This study's novelty lies in three main aspects. First, a quantitative analysis of the effect of the PWM duty cycle on the minimum voltage and voltage ripple at the same rectifier under open-loop conditions is performed. The simulation results revealed that the maximum voltage was relatively close to the theoretical value of 64.8 V. In contrast, the voltage ripple increased from 1.4–2.2% at a 30% duty cycle to 8.2–9.8% at a 50–95% duty cycle, exceeding the theoretical value of 4.2% for an ideal six-pulse rectifier. Second, the rectifier performance under open-loop and closed-loop conditions was evaluated using PI controllers at two input voltages, namely, 48 V and 36 V, as well as six resistive (R) and resistive–inductive (R–L) load variations in one structured test scenario. Third, system-level simulation integration using MATLAB/Simulink and circuit-level simulation using Proteus were used to evaluate the characteristics. The effectiveness of the PI feedback was evaluated by comparing the open-loop and closed-loop performance at 36 V and 48 V input voltages with R and R–L load variations. An evaluation in MATLAB/Simulink and Proteus revealed that the PI controller reduced the voltage ripple from approximately 9–10% to 1–3% under the simulated conditions tested. Thus, this study's main contribution is a structured quantitative analysis of the effects of the duty cycle, input voltage variation, load characteristics, and PI control under the same rectifier configuration, providing a basis for further development and experimental validation of rectifiers in low-speed PMSG applications.
Acknowledgment
Not applicable.
Funding Declaration
This research did not receive any specific grant from funding agencies in the public, commercial, or not-for-profit sectors.
Conflict of Interest
There is no conflict of interest.
Artificial Intelligence (AI) Use Disclosure
The authors declare that artificial intelligence (AI)-assisted tools were used only for language refinement, grammar improvement, and manuscript structuring purposes during the preparation of this work. All technical content, experimental implementation, results, and interpretations were independently developed and verified by the authors.
Supporting Information
Not applicable.
References
- [1] S. Karlilar Pata, M. Balcilar, Decarbonizing energy: Evaluating fossil fuel displacement by renewables in OECD countries, Environmental Science and Pollution Research, 2024, 31, 31304-31313, doi: 10.1007/s11356-024-33324-8.
- [2] N. A. Pambudi, R. A. Firdaus, R. Rizkiana, D. K. Ulfa, M. S. Salsabila, S. Suharno, Renewable energy in Indonesia: current status, potential, and future development, Sustainability, 2023, 15, 2342, doi: 10.3390/su15032342.
- [3] Hingga 2030, Pemerintah Bidik Tambahan Kapasitas Terpasang PLTB 5 GW, 2024, https://www.esdm.go.id/id/media-center/arsip-berita/hingga-2030-pemerintah-bidik-tambahan-kapasitas-terpasang-pltb-5-gw-, Accessed 15 August 2026.
- [4] N. A. Pambudi, D. K. Ulfa, I. R. Nanda, I. M. Gandidi, A. Wiyono, M. K. Biddinika, B. Rudiyanto, L. H. Saw, The future of wind power plants in Indonesia: Potential, challenges, and policies, Sustainability, 2025, 17, 1312, doi: 10.3390/su17031312.
- [5] J. Langer, M. Zaaijer, J. Quist, K. Blok, Introducing site selection flexibility to technical and economic onshore wind potential assessments: New method with application to Indonesia, Renewable Energy, 2023, 202, 320–335, doi: 10.1016/j.renene.2022.11.084.
- [6] J. Langer, S. Simanjuntak, S. Pfenninger, A. J. Laguna, G. Lavidas, H. Polinder, J. Quist, H. P. Rahayu, K. Blok, How offshore wind could become economically attractive in low-resource regions like Indonesia, Iscience, 2022, 25, 104945, doi: 10.1016/j.isci.2022.104945.
- [7] A. Y. Megawati, F. F. Haryani, Sukarmin, Sarwanto, D. Wahyuningsih, Pujayanto, Supurwoko, An overview of wind energy to optimize initial potential in Java, E3S Web of Conferences, EDP Sciences, 475, 12, doi: 10.1051/e3sconf/202447503001.
- [8] N. A. Elsonbaty, M. A. Enany, M. M. Elymany, Hybrid permanent magnet synchronous generator as an efficient wind energy transducer for modern wind turbines, Wind Engineering, 2024, 48, 1203-1223, doi: 10.1177/0309524X241256957.
- [9] A. Jain, S. Shankar, V. J. Vanitha, Power generation using permanent magnet synchronous generator (PMSG) based variable speed wind energy conversion system (WECS): An overview, Journal of Green Engineering, 2018, 4, 477-504, doi: 10.13052/jge1904-4720.742.
- [10] F. Aryanto, M. Mara, M. Nuarsa, Pengaruh kecepatan angin dan variasi jumlah sudu terhadap unjuk kerja turbin angin poros horizontal, Dinamika Teknik Mesin, 2013, 3.
- [11] T. Thentral, R. Rathakrishnan, V. Anbalagan, K. Dhandapani, U. Sengamalai, P. Ramasamy, Mitigation of current harmonics in multi-drive system, International Journal of Power Electronics and Drive Systems, 2022, 13, 113, doi: 10.11591/ijpeds.v13.i1.pp113-121.
- [12] R. Indrianto, S. Hariyadi, PENGUKURAN HARMONIK PADA PENYEARAH TIGA FASA DENGAN MENGGUNAKAN MATLAB SIMULINK, Jurnal Penelitian: Politeknik Penerbangan Surabaya, 2020, 5, 316-323, doi: 10.46491/jp.v5i4.547.
- [13] M. Rahimi, Modeling, control and stability analysis of grid connected PMSG based wind turbine assisted with diode rectifier and boost converter, International Journal of Electrical Power & Energy Systems, 2017, 93, 84-96, doi: 10.1016/j.ijepes.2017.05.019.
- [14] D. B. Tchoumtcha, C. T. Dagang, G. Kenne, Synergetic control for stand-alone permanent magnet synchronous generator driven by variable wind turbine, International Journal of Dynamics and Control, 2024, 12, 2888-2902, doi: 10.1007/s40435-024-01384-w.
- [15] A. Alili, M. B. Camara, B. Dakyo, Vienna Rectifier-Based Control of a PMSG Wind Turbine Generator, Processes, 2022, 10, 413, doi: 10.3390/pr10020413.
- [16] A. Rajaei, M. Mohamadian, A. Yazdian, Efficiency analysis of vienna rectifier-based grid interface systems for low-power pm wecs, Iranian Journal of Science and Technology, Transactions of Electrical Engineering, 2019, 43, 577-586, doi: 10.1007/s40998-019-00185-8.
- [17] S. Annisa, M. F. Immanuel, S. Pratama, M. Ashari, D. P. Saragi, A Novel Simulink-Based Implementation of Cosine Comparator Logic for Gate Control in Three-Phase Controlled Rectifiers, Techno. Com, 2025, 24, 1086, doi: 10.62411/tc.v24i3.13369.
- [18] H. Acikgoz, C. Yildiz, R. Coteli, B. Dandil, DC-link voltage control of three-phase PWM rectifier by using artificial bee colony based type-2 fuzzy neural network, Microprocessors and Microsystems, 2020, 78, 103250, doi: 10.1016/j.micpro.2020.103250.
- [19] M. Li, X. Wu, S. Huang, G. Liang, Model predictive direct power control using optimal section selection for PWM rectifier with reduced calculation burden, International Journal of Electrical Power & Energy Systems, 2020, 116, 105552, doi: 10.1016/j.ijepes.2019.105552.
- [20] A. Bouafia, F. Krim, J. P. Gaubert, Design and implementation of high performance direct power control of three-phase PWM rectifier, via fuzzy and PI controller for output voltage regulation, Energy conversion and management, 2009, 50, 6-13, doi: 10.1016/j.enconman.2008.09.011.
- [21] R. Sanchis, I. Peñarrocha-Alós, A new method for experimental tuning of PI controllers based on the step response, ISA transactions, 2022, 128, 329-342, doi: 10.1016/j.isatra.2021.09.008.
- [22] Z. Zhou, J. Song, Y. Yu, Q. Xu, X. Zhou, Research on high-quality control technology for three-phase PWM rectifier, Electronics, 2023, 12, 2417, doi: 10.3390/electronics12112417.
- [23] T. Nurwati, G. Gradianto, B. Siswoyo, B. Mosaddegh, I. N. Satiawan, Discrete Implementation of a PI Controller for Three-Phase PWM Rectifier, Jurnal EECCIS, 2024, 18, 58-62, doi: 10.21776/jeeccis.v18i2.1666.
- [24] S. Chincholkar, M. Tariq, M. Poshtan, M. Sharaf, Normalized error-based PI controller and its application to the DC–DC buck converter, Mathematics, 2024, 12, 240, doi: 10.3390/math12020240.
- [25] L. D. M. Uc, V. M. R. Rivera, D. A. U. Sosa, B. Saldivar, Experimental Validation of PI Controller Optimization Using LPO and PSO for a DC–DC Boost Converter., Sci, 2026, 8, 250, doi: 10.3390/sci8090250.
- [26] N. Mrabet, C. Benzazah, C. Mohssine, E. A. Ahmed, K. Driss, R. Badr, L. Ilyas, Enhancing wind energy conversion efficiency: a novel MPPT approach using P&O with ADRC controllers versus PI controllers with Kp and Ki optimization via genetic algorithm and ant colony optimization, Cleaner Energy Systems, 2024, 9, 100159, doi: 10.1016/j.cles.2024.100159.
- [27] G. Shwetha, K. P. Guruswamy, An improved WOA of PI control for three phase PWM rectifier, Indonesian Journal of Electrical Engineering and Computer Science, 2025, 38, 39-49, doi: 10.11591/ijeecs.v38.i1.pp39-49.
- [28] A. Alzahrani, Experimental Investigation of Controlled and Uncontrolled Rectifiers for Low-Power Wind Turbines, Applied Sciences, 2023, 13, 4120, doi: 10.3390/app13074120.
- [29] T. R. S. de Freitas, P. J. M. Menegáz, D. S. L. Simonetti, Rectifier topologies for permanent magnet synchronous generator on wind energy conversion systems: A review, Renewable and Sustainable Energy Reviews, 2016, 54, 1334-1344, doi: 10.1016/j.rser.2015.10.112.
- [30] V. Yaramasu, A. Dekka, M. J. Durán, S. Kouro, B. Wu, PMSG‐based wind energy conversion systems: survey on power converters and controls, IET Electric Power Applications, 2017, 11, 956-968, doi: 10.1049/iet-epa.2016.0799.
- [31] F. Blaabjerg, M. Chen, L. Huang, Power electronics in wind generation systems, Nature Reviews Electrical Engineering, 2024, 1, 234-250, doi: 10.1038/s44287-024-00032-x.
- [32] E. Banguero, A. Correcher, Á. Pérez-Navarro, F. Morant, A. Aristizabal, A review on battery charging and discharging control strategies: Application to renewable energy systems, Energies, 2018, 11, 1021, doi: 10.3390/en11041021.
- [33] J. Jittakort, A. Aurasopon, A digitally controlled adaptive current interface for accurate measurement of resistive sensors in embedded sensing systems, Journal of Sensor and Actuator Networks, 2025, 14, 82, doi: 10.3390/jsan14040082.
- [34] M. Rashid, Power Electronics: Devices, Circuits, and Applications. Pearson, 4th ed., 2014, https://books.google.co.id/books?id=KRD9mAEACAAJ.
Publisher Note
Publisher Note: The views, statements, and data in all publications solely belong to the authors and contributors. GR Scholastic is not responsible for any injury resulting from the ideas, methods, or products mentioned. GR Scholastic remains neutral regarding jurisdictional claims in published maps and institutional affiliations.
Open Access
This article is licensed under a Creative Commons Attribution-NonCommercial 4.0 International License, which permits the non-commercial use, sharing, adaptation, distribution and reproduction in any medium or format, as long as appropriate credit to the original author(s) and the source is given by providing a link to the Creative Commons License and changes need to be indicated if there are any. The images or other third-party material in this article are included in the article's Creative Commons License, unless indicated otherwise in a credit line to the material. If material is not included in the article's Creative Commons License and your intended use is not permitted by statutory regulation or exceeds the permitted use, you will need to obtain permission directly from the copyright holder. To view a copy of this License, visit: https://creativecommons.org/licenses/by-nc/4.0/
© The Author(s) 2026